Net Flow
Bullish premium against bearish premium, netted out, to show which way the options money is leaning.
- One number for the lean
- Market and single stock
- Over time, not just now
The question it answers
Is the options money leaning up or down?
Overview
What is Net Flow on MrChart?
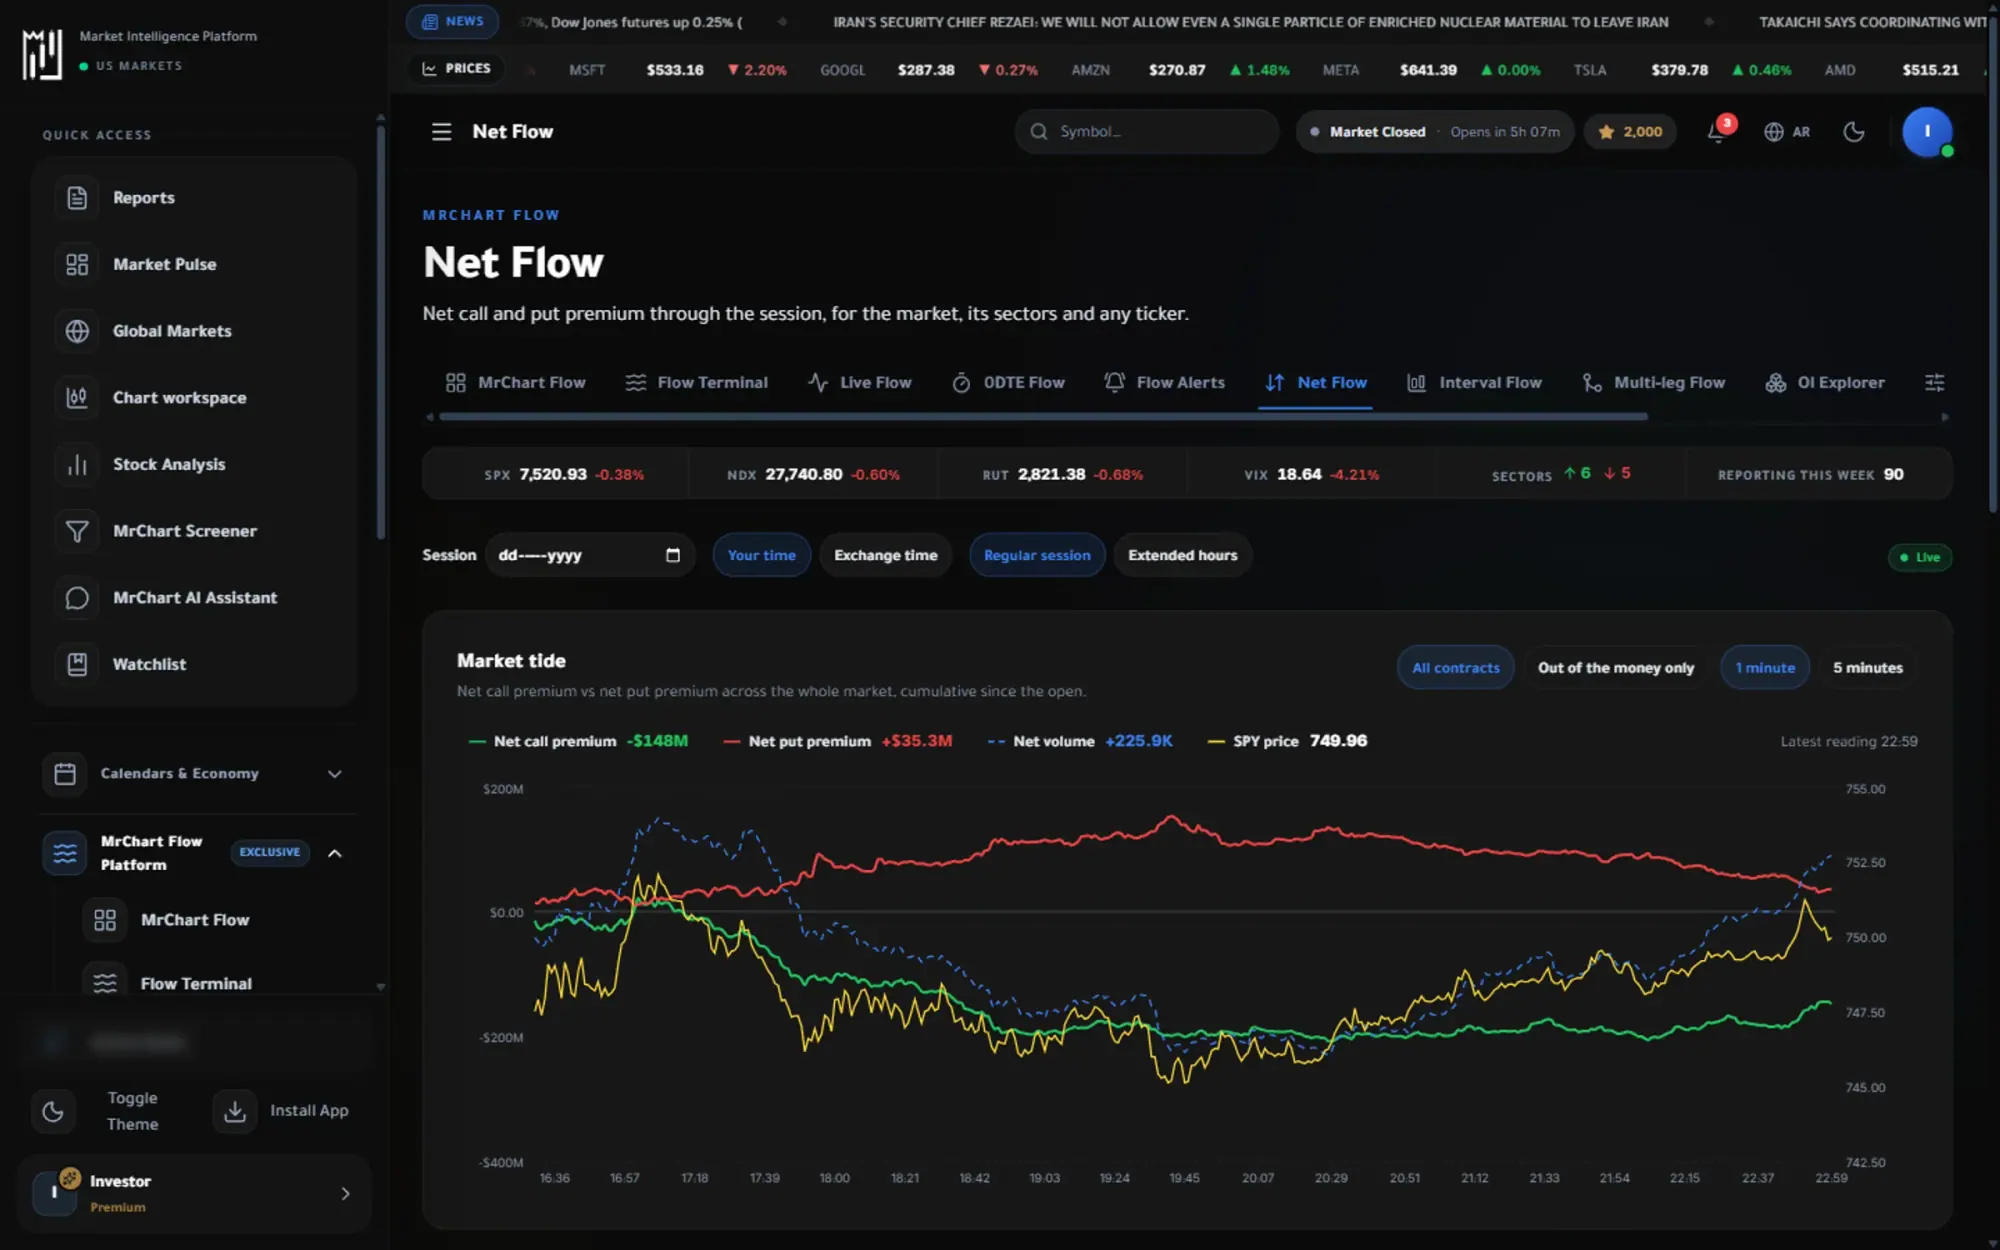
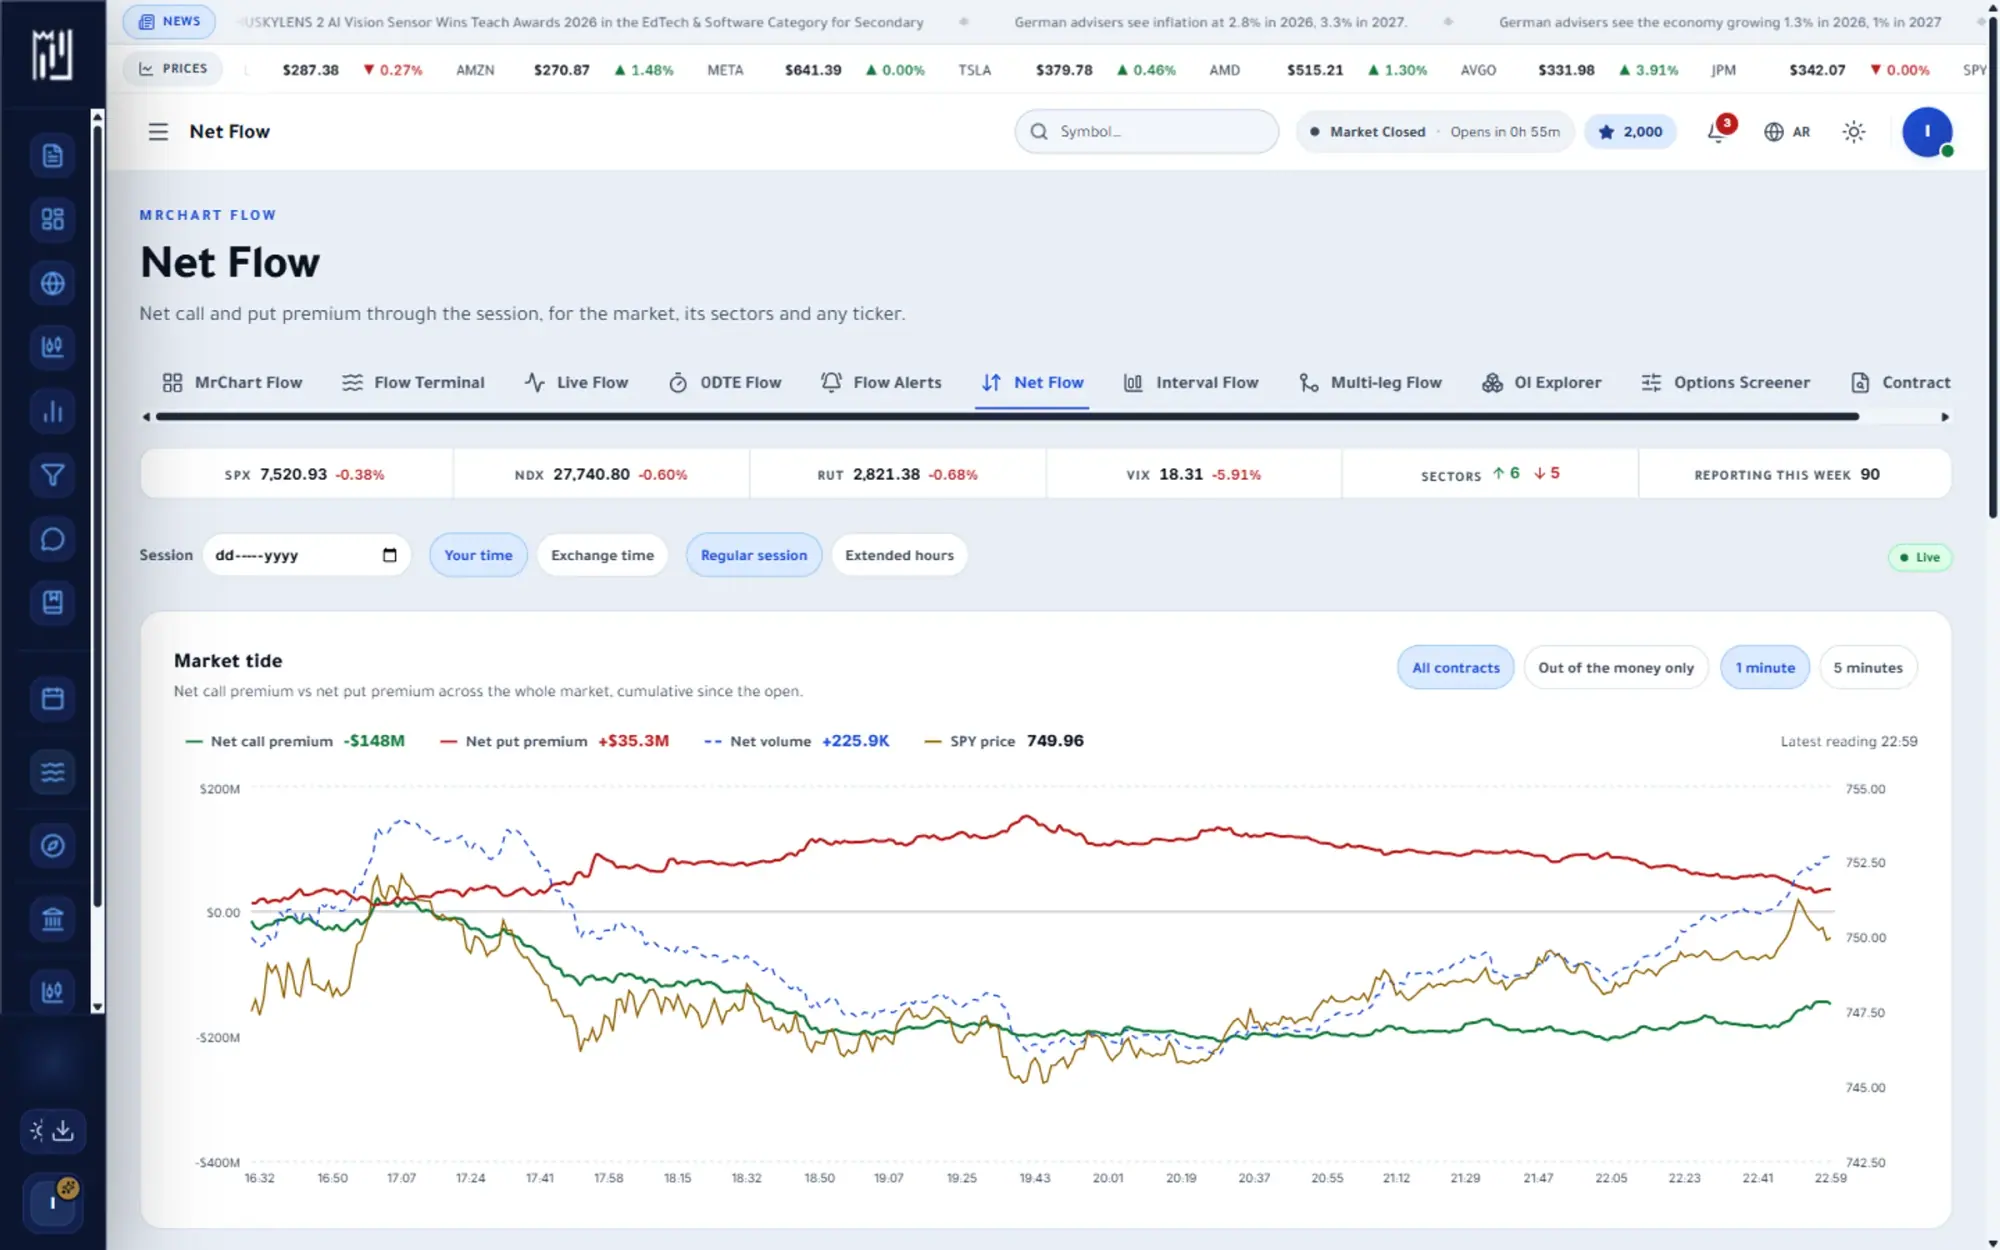
Net Flow adds up call premium and put premium through the session to show where options money has been leaning. The market tide chart tracks net call premium against net put premium across the whole market, cumulative since the open, so you read the day's options flow as one line rather than thousands of trades.
You can go further than the market. See the tide for each sector, net flow by expiry (weekly and 0DTE) and by moneyness, or search a single ticker for its own net premium. Switch between all contracts and out-of-the-money only, and open past sessions. It describes where premium went, not where price will go.
What you get
Why use Net Flow
How it works
How to use Net Flow in three steps
- 01
Read the market tide
Follow net call premium and net put premium from the open, and choose one-minute or five-minute resolution.
- 02
Break it down
Check the sector tides, then net flow by expiry and by moneyness, meaning in, at and out of the money.
- 03
Zoom to one ticker
Search a symbol to chart its net premium through the session, and set the time to your own time or exchange time.
Who it helps
Where it fits in your day
A quick read on the day
Check whether net call premium or net put premium has led so far, and how that changed during the session.
Finding sector themes
Compare sector tides to see which areas of the market drew the most one-sided options premium.
Studying one stock
Look at a single ticker's net premium next to its price to understand how options activity moved with it.
Questions
Frequently asked questions
What is net premium in options flow?
Premium is the money paid for options contracts. Net premium nets call premium against put premium, based on which side of the quote trades filled, to summarise which way the options money leaned.
What is the market tide?
It is a cumulative chart of net call premium and net put premium across the whole market since the open. It gives a one-line picture of the day's options sentiment.
Does net flow predict where the market is going?
No. Net flow describes what traders paid for options so far, which is useful context. It is not a forecast and should not be used as a standalone signal.
See it on your own screen
Create a free account and open it in the platform. MrChart is an analytics and education platform. It does not give buy or sell recommendations or investment advice.