Interval Flow
Options flow cut into time intervals, so you can see when the activity arrived and how it built.
- Flow by time slice
- Spot the surge
- Calls and puts apart
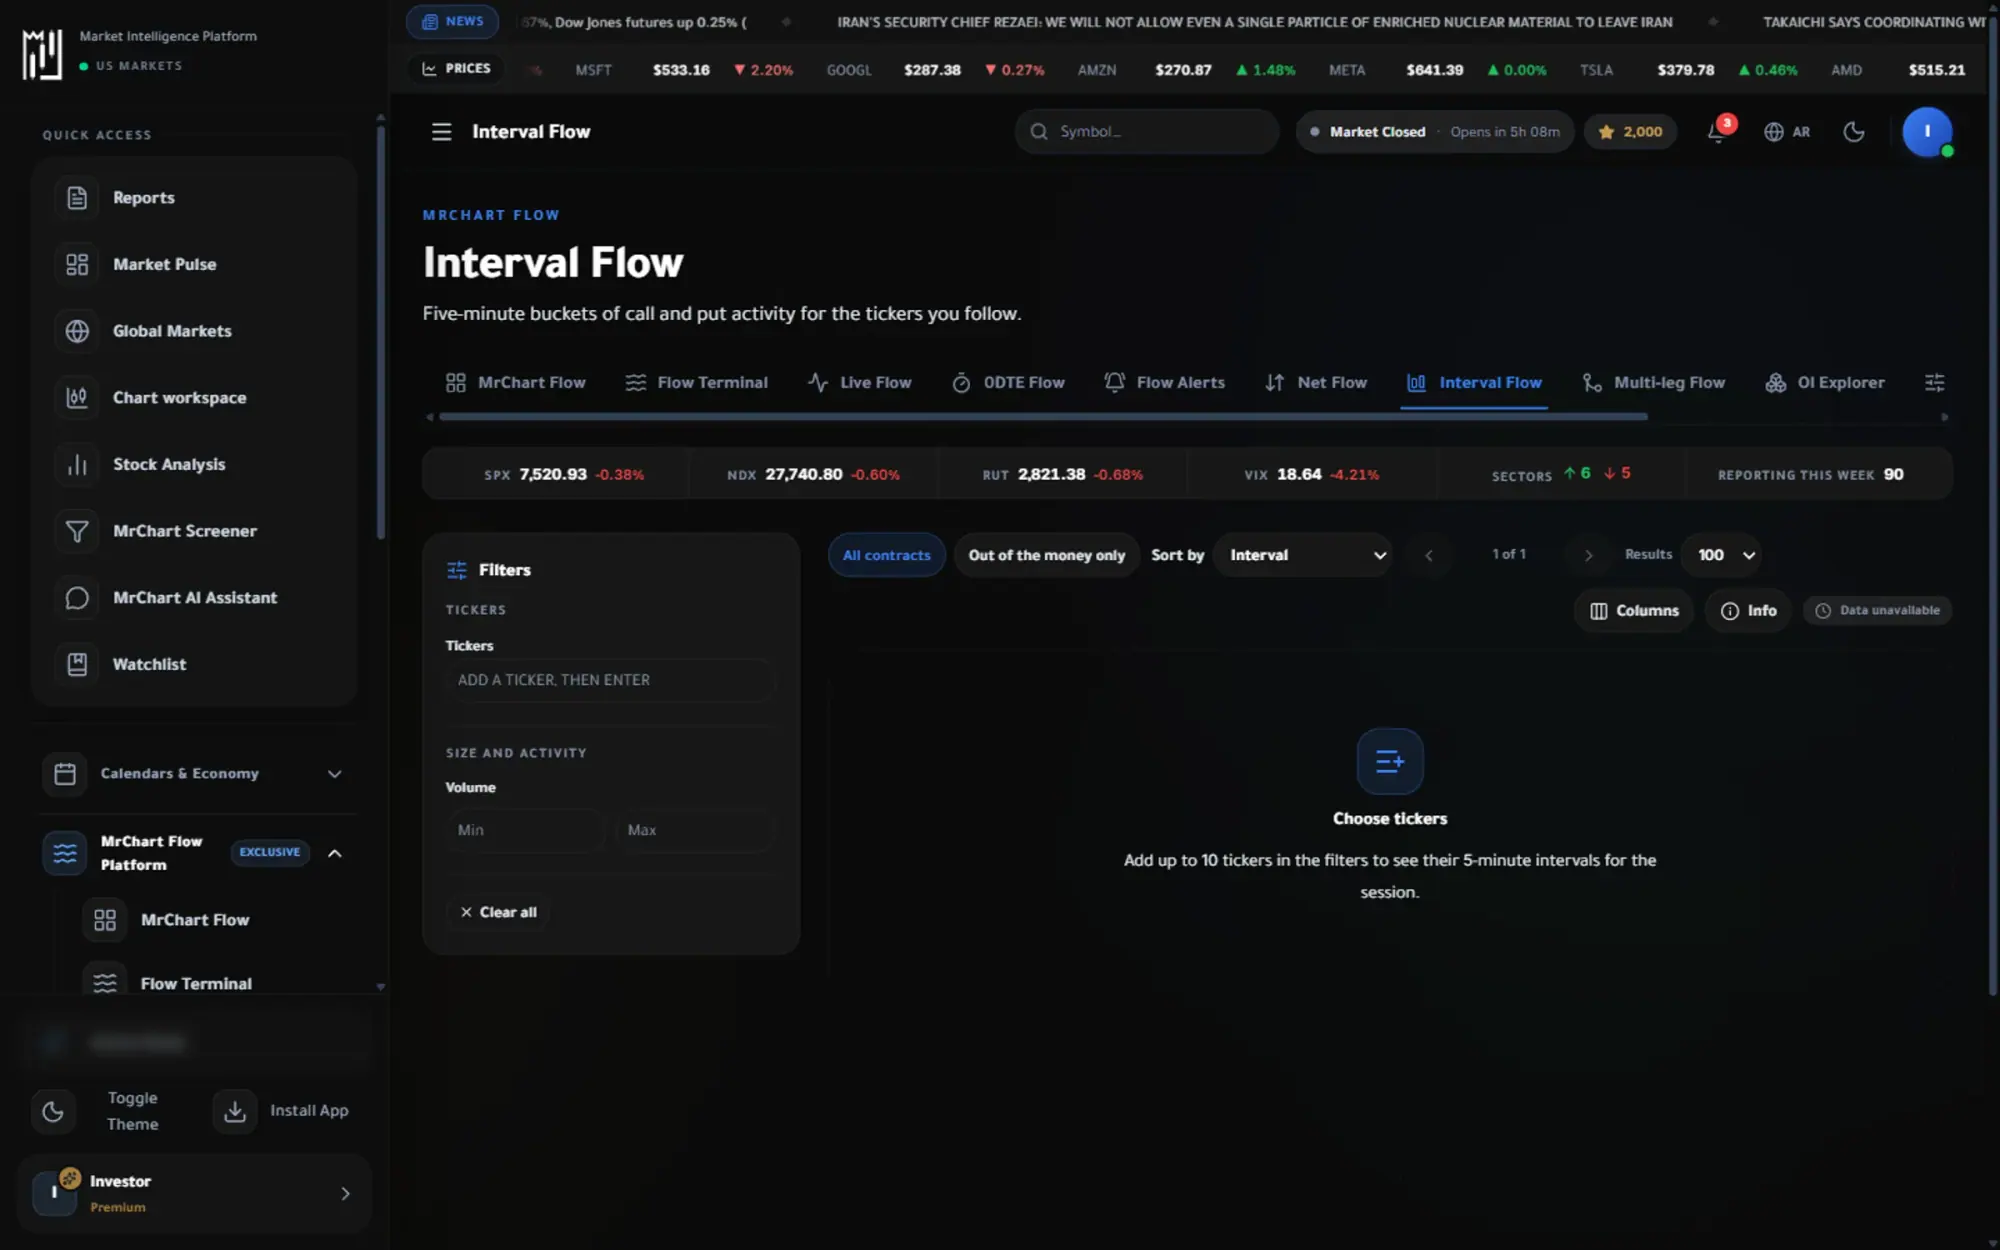
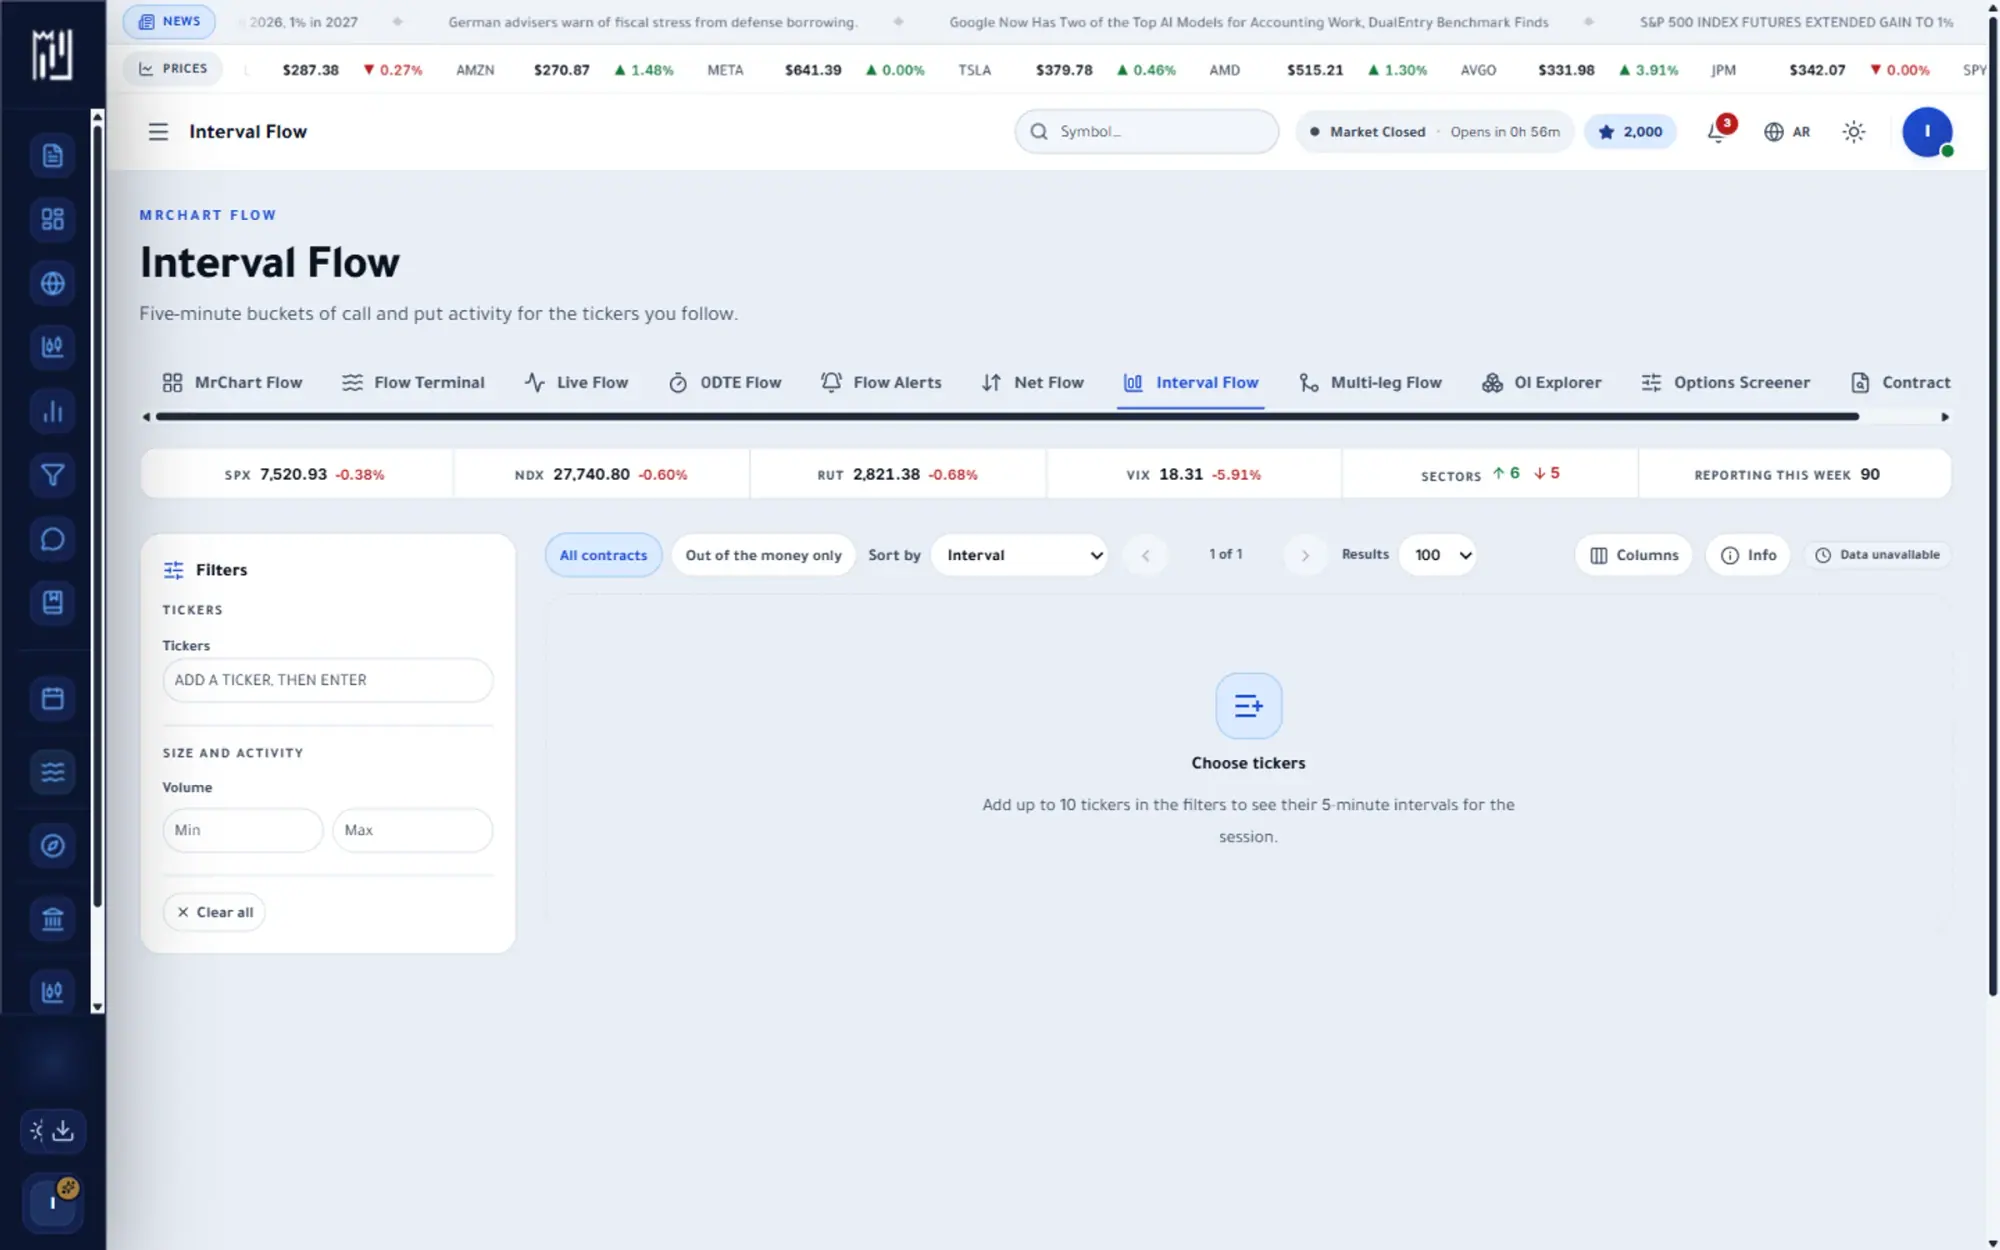
The question it answers
When did the money come in?
Overview
What is Interval Flow on MrChart?
Interval Flow cuts options flow into five-minute buckets for the tickers you choose, so you can see when activity arrived and how it built through the session. Each row is one interval for one ticker, with call and put volume, premium, and how much of it filled near the ask or near the bid.
A single large print can hide in a long tape, but in a time bucket a burst stands out against the quiet intervals around it. Open any interval to see its volume by side, its net premium and a chart of the session so far. That helps you understand the rhythm of the flow, not guess the next move.
In the platform
A closer look at Interval Flow
What you get
Why use Interval Flow
Flow by time slice
See premium and volume in five-minute, hourly or daily intervals.
Spot the surge
A burst of activity stands out against the quiet stretches around it.
Calls and puts apart
Follow each side separately to see which one led.
How it works
How to use Interval Flow in three steps
- 01
Choose your tickers
Add the tickers you follow in the filters; the page needs at least one to build its five-minute intervals.
- 02
Pick the contracts
Look at all contracts or only those out of the money, and sort the rows by the measure you care about.
- 03
Open an interval
See that bucket's volume by side, net premium and how it compares with the rest of the session on the session chart.
Who it helps
Where it fits in your day
Timing a burst
Find the exact five minutes in which a stock's options premium jumped, then match it with news or the price chart.
Seeing which side led
Compare call and put activity in each interval to see which side carried the session at different hours.
Reviewing a quiet day
Check whether activity was steady or concentrated into a few intervals, which tells you how the day really traded.
Questions
Frequently asked questions
What is interval flow?
It is options flow added up in fixed time slices. Here each slice is five minutes long, so you can see how call and put activity changed over the session.
What does net premium mean in an interval?
Net premium compares the money spent on contracts that filled near the ask with the money spent on contracts that filled near the bid. It describes how the interval traded, not what comes next.
Why do I need to choose tickers first?
Five-minute data for the whole market would be too much to read at once. Picking the names you follow keeps the page focused on the intervals that matter to you.
See it on your own screen
Create a free account and open it in the platform. MrChart is an analytics and education platform. It does not give buy or sell recommendations or investment advice.