Flow Terminal
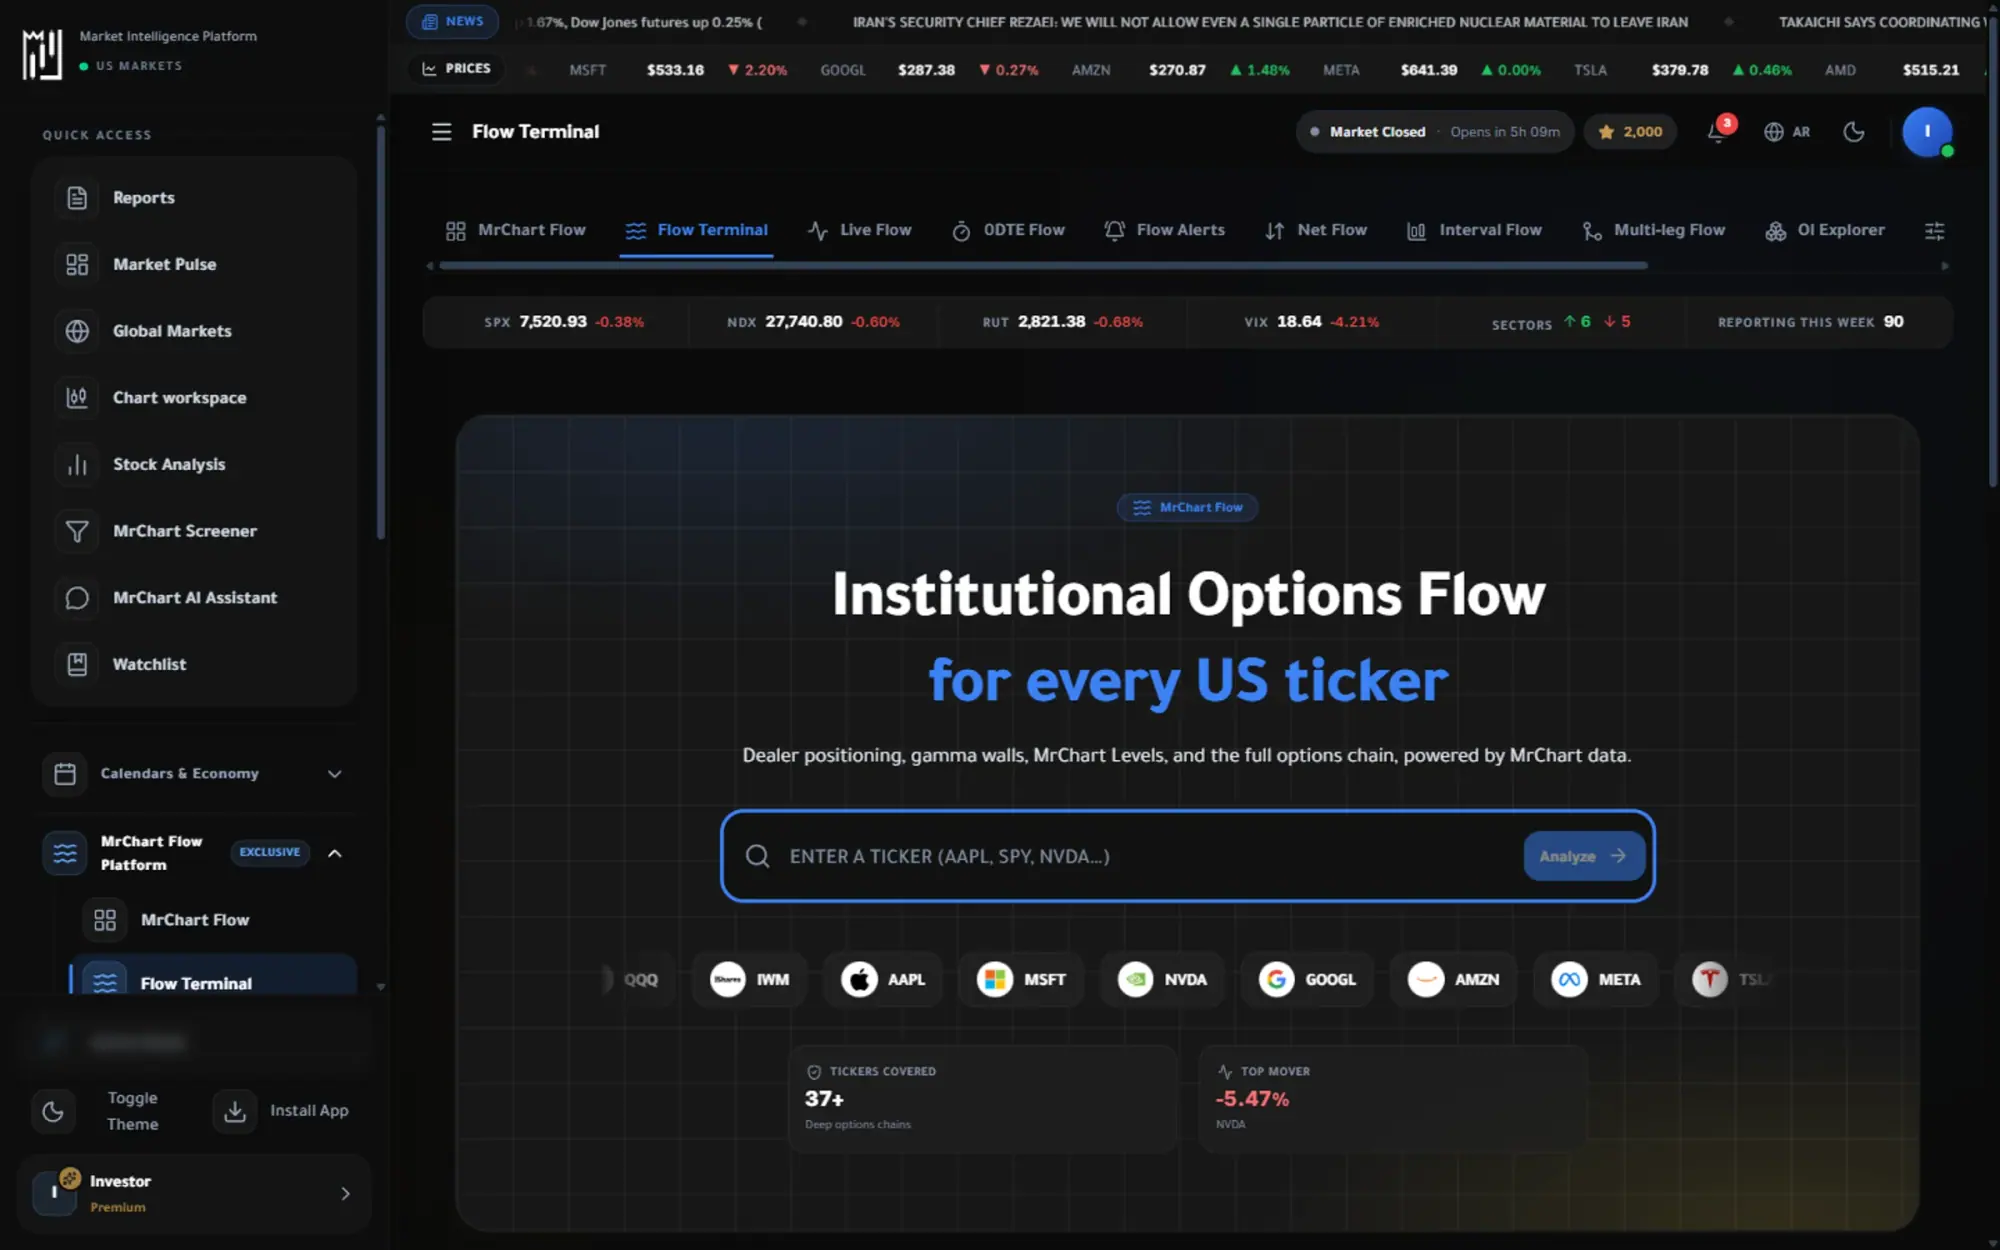
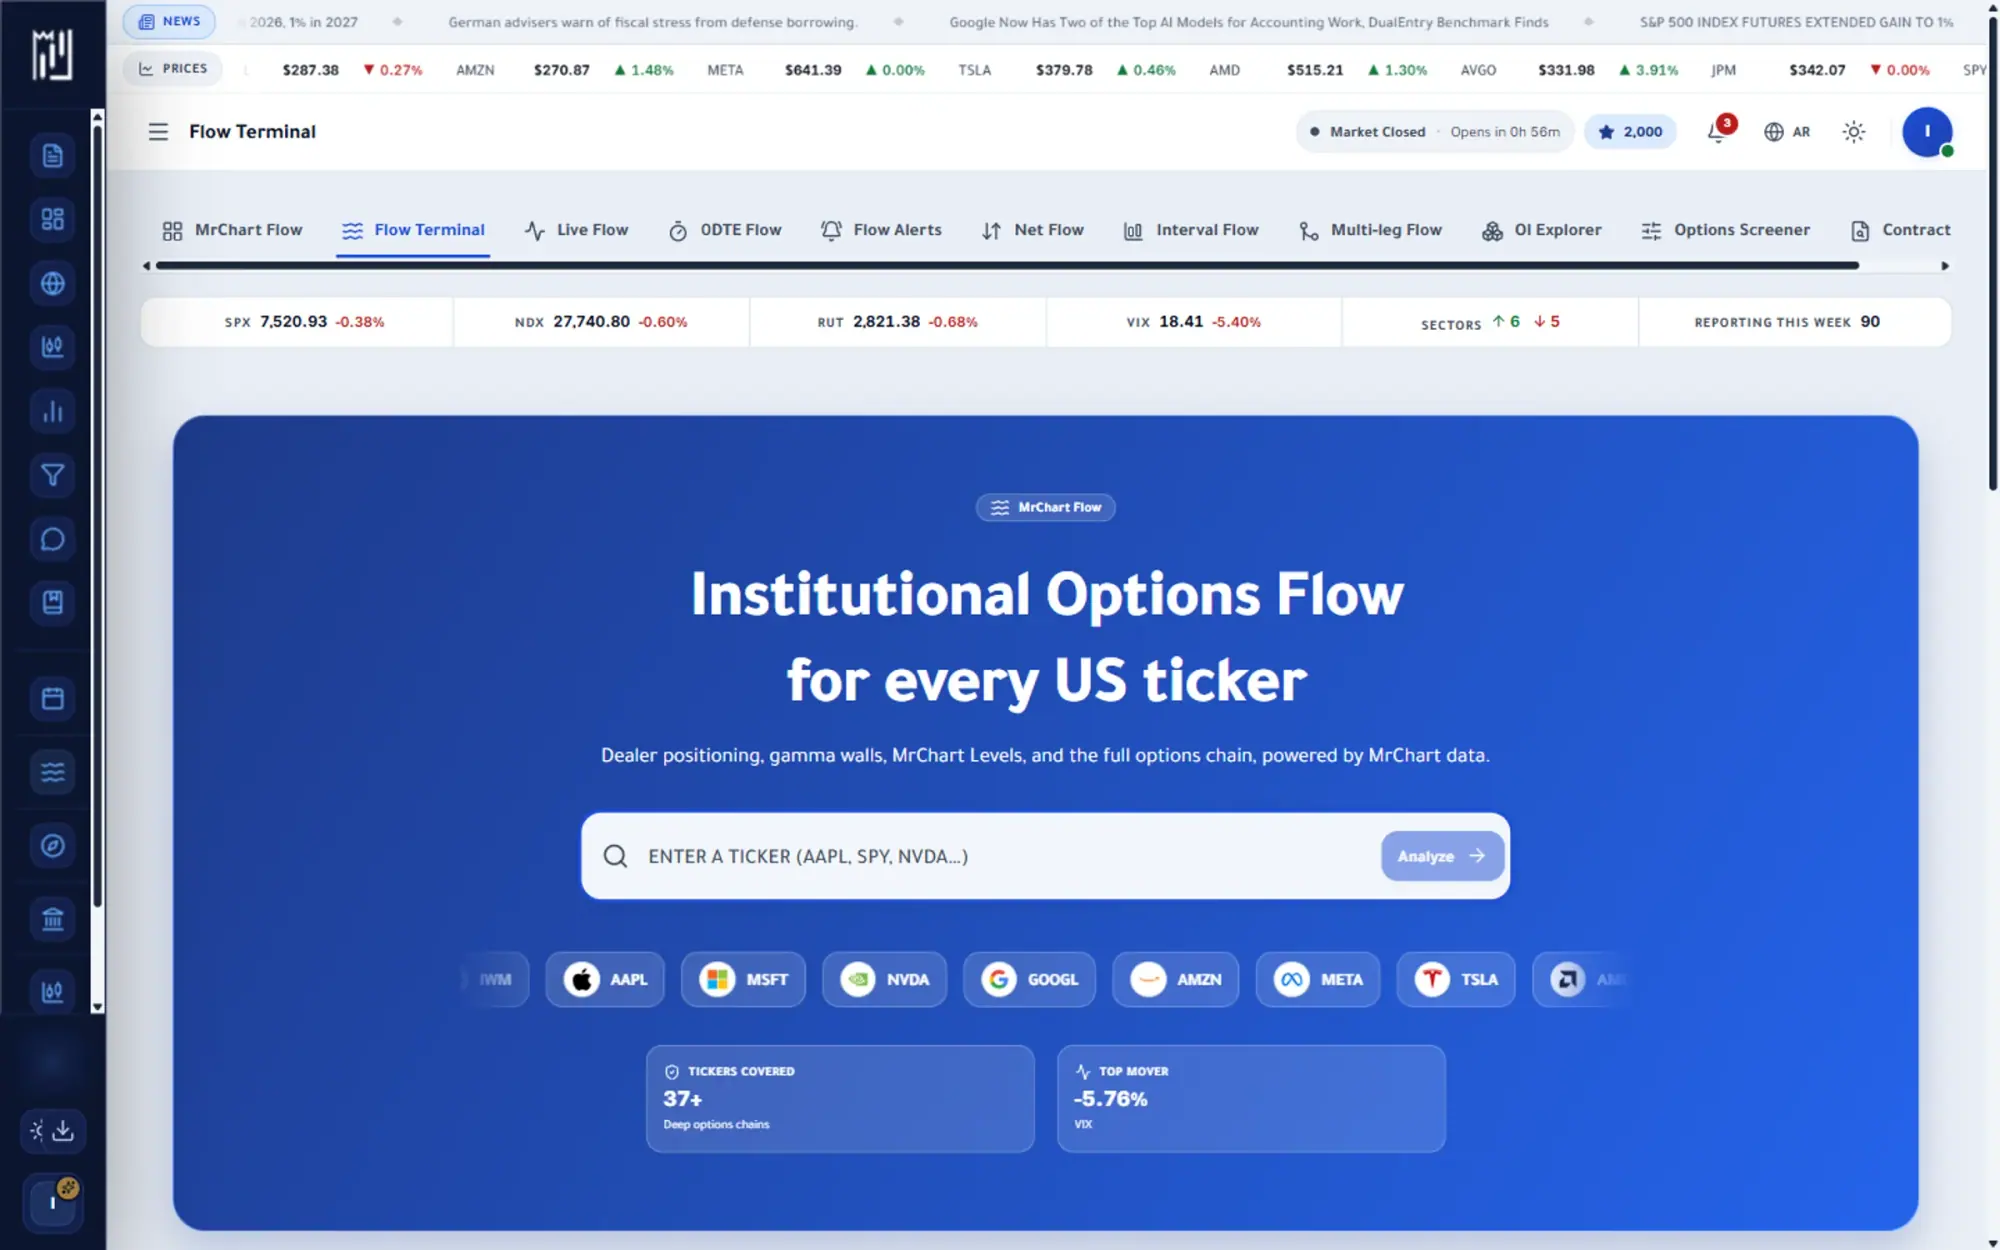
The home of MrChart Flow: the options market read as it happens, from the biggest trades to the positioning behind them.
- Options flow made readable
- Market maker positioning
- One terminal, many views
The question it answers
What are the big players doing in options right now?
Overview
What is Flow Terminal on MrChart?
The Flow Terminal is the home of MrChart Flow, built around one ticker at a time. Search a stock, ETF or index and its options picture opens in one place: MrChart Levels, dealer positioning, gamma exposure by strike and expiry, and the contracts behind them. It turns raw options flow into context you can read in minutes.
Options market makers hedge the contracts they sell, so where open interest and gamma pile up can shape how a stock behaves around certain strikes. The terminal shows that positioning beside volume, open interest and unusual options activity, so you can compare each layer. It is context for your own research, not a signal to trade.
What you get
Why use Flow Terminal
How it works
How to use Flow Terminal in three steps
- 01
Search a ticker
Enter a symbol to load its summary, exposure cards and levels, with the price chart one click away.
- 02
Read the positioning
Check gamma and delta exposure by strike and by expiry, along with the whale support and whale resistance levels the page marks.
- 03
Go down to the contracts
Open the contracts section for open interest, volume and unusual activity at individual strikes, then jump into any single contract.
Who it helps
Where it fits in your day
Preparing for the session
See where options positioning clusters around the current price before you start studying a chart.
Understanding a stall
When a stock keeps stopping near one price, check the open interest and exposure sitting at that strike.
Comparing names
Switch tickers and read the same layers side by side to see which stock carries heavier options positioning.
Questions
Frequently asked questions
What is the Flow Terminal?
It is the main page of MrChart Flow, where one ticker is shown in depth: its levels, dealer positioning, gamma exposure and the contracts behind them. Other Flow tools, such as the live tape and alerts, link into it.
What is gamma exposure and why does it matter?
Gamma exposure estimates how much dealers may need to adjust their hedges as the stock price moves. Large exposure at a strike can make price behave differently near that level, which is why it is shown as context.
Is the Flow Terminal free to use?
It depends on your plan. What each plan includes is shown on the pricing page.
See it on your own screen
Create a free account and open it in the platform. MrChart is an analytics and education platform. It does not give buy or sell recommendations or investment advice.