Flow Alerts
The unusual options trades, picked out of the noise and explained, so you see the signal first.
- Unusual activity, flagged
- Why it was flagged
- Your own alert rules
The question it answers
Which trades are out of the ordinary?
Overview
What is Flow Alerts on MrChart?
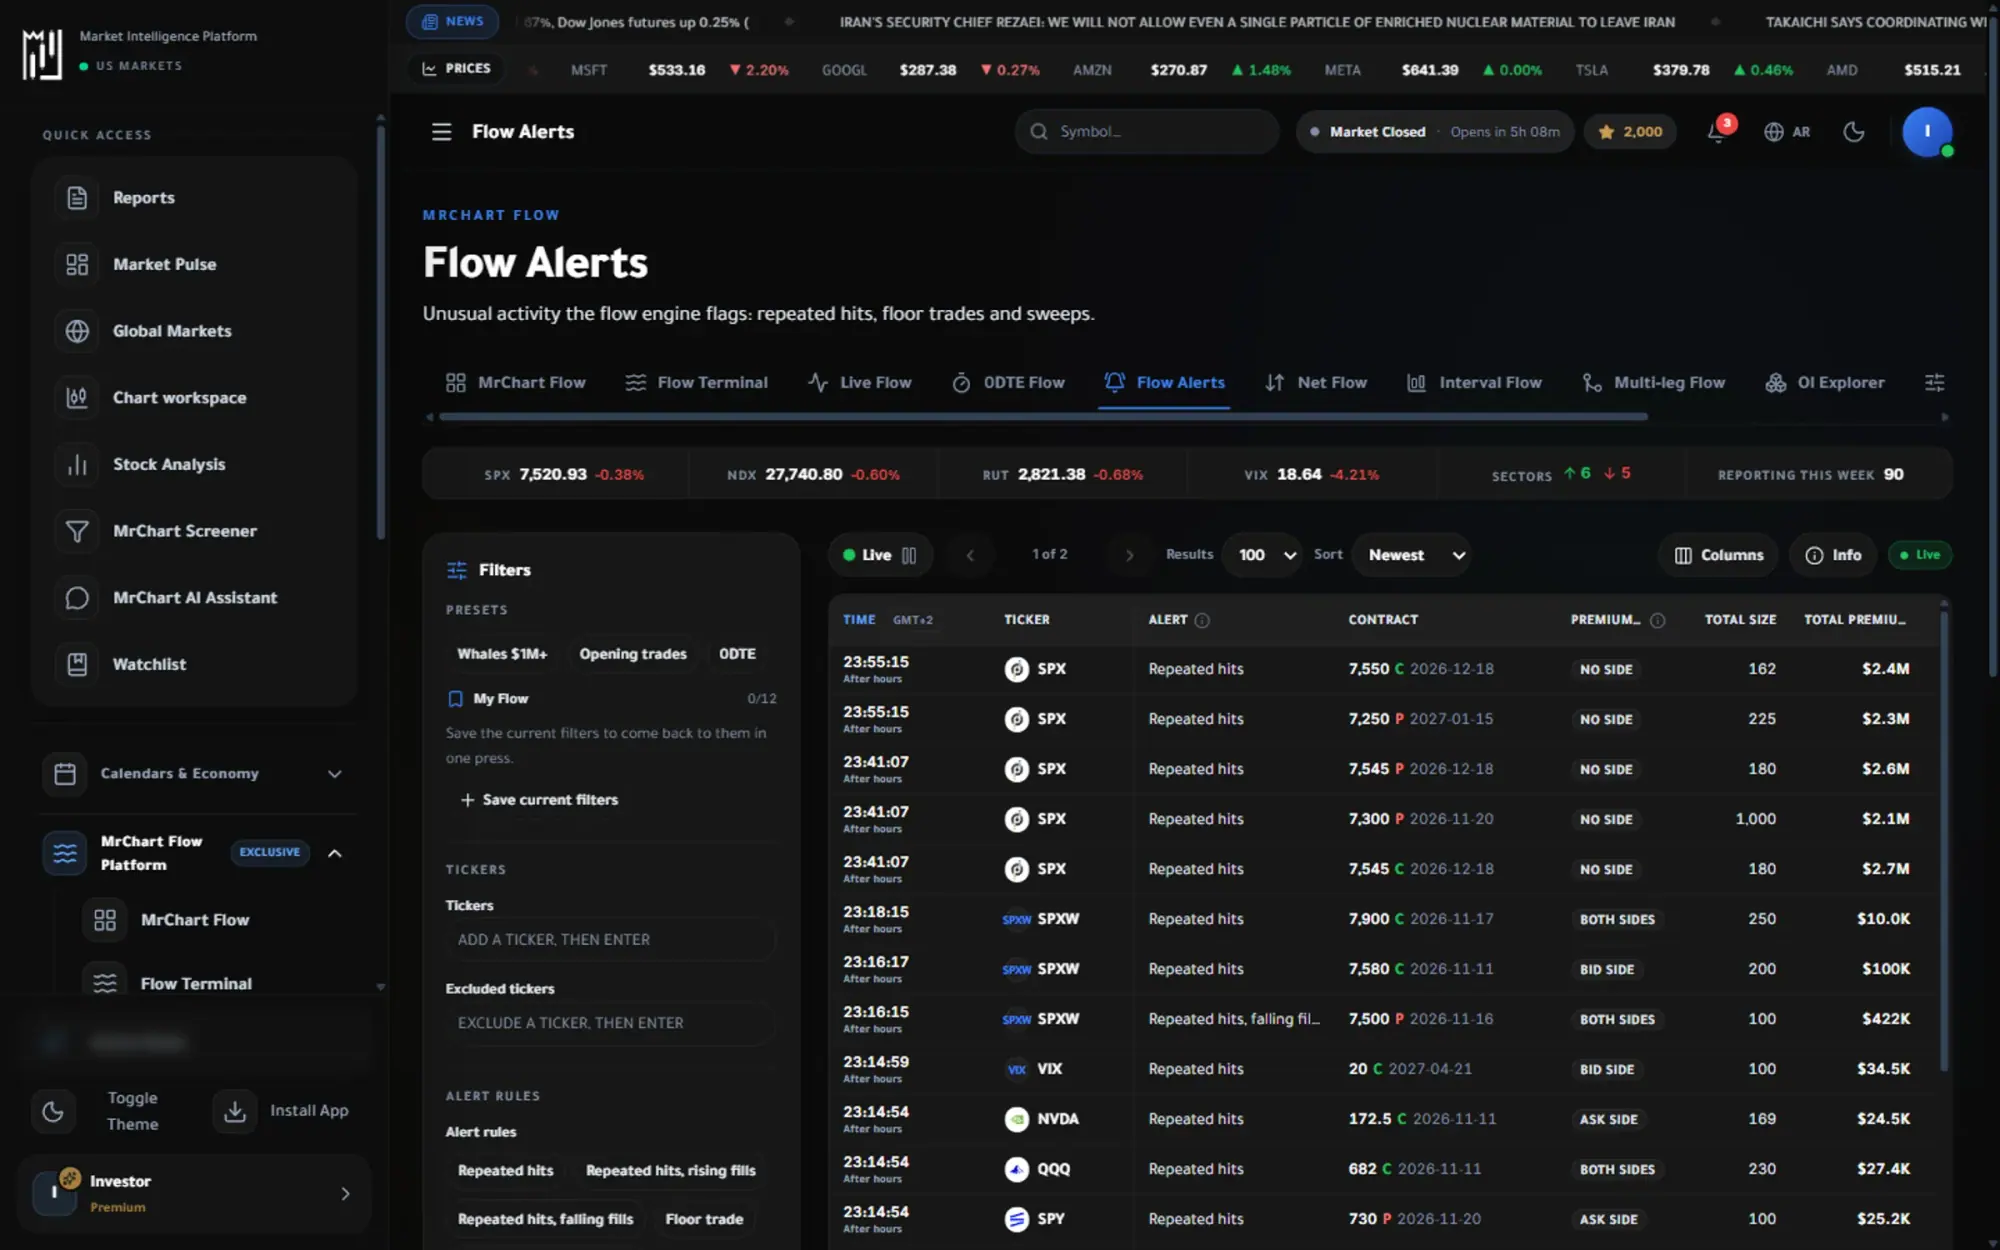
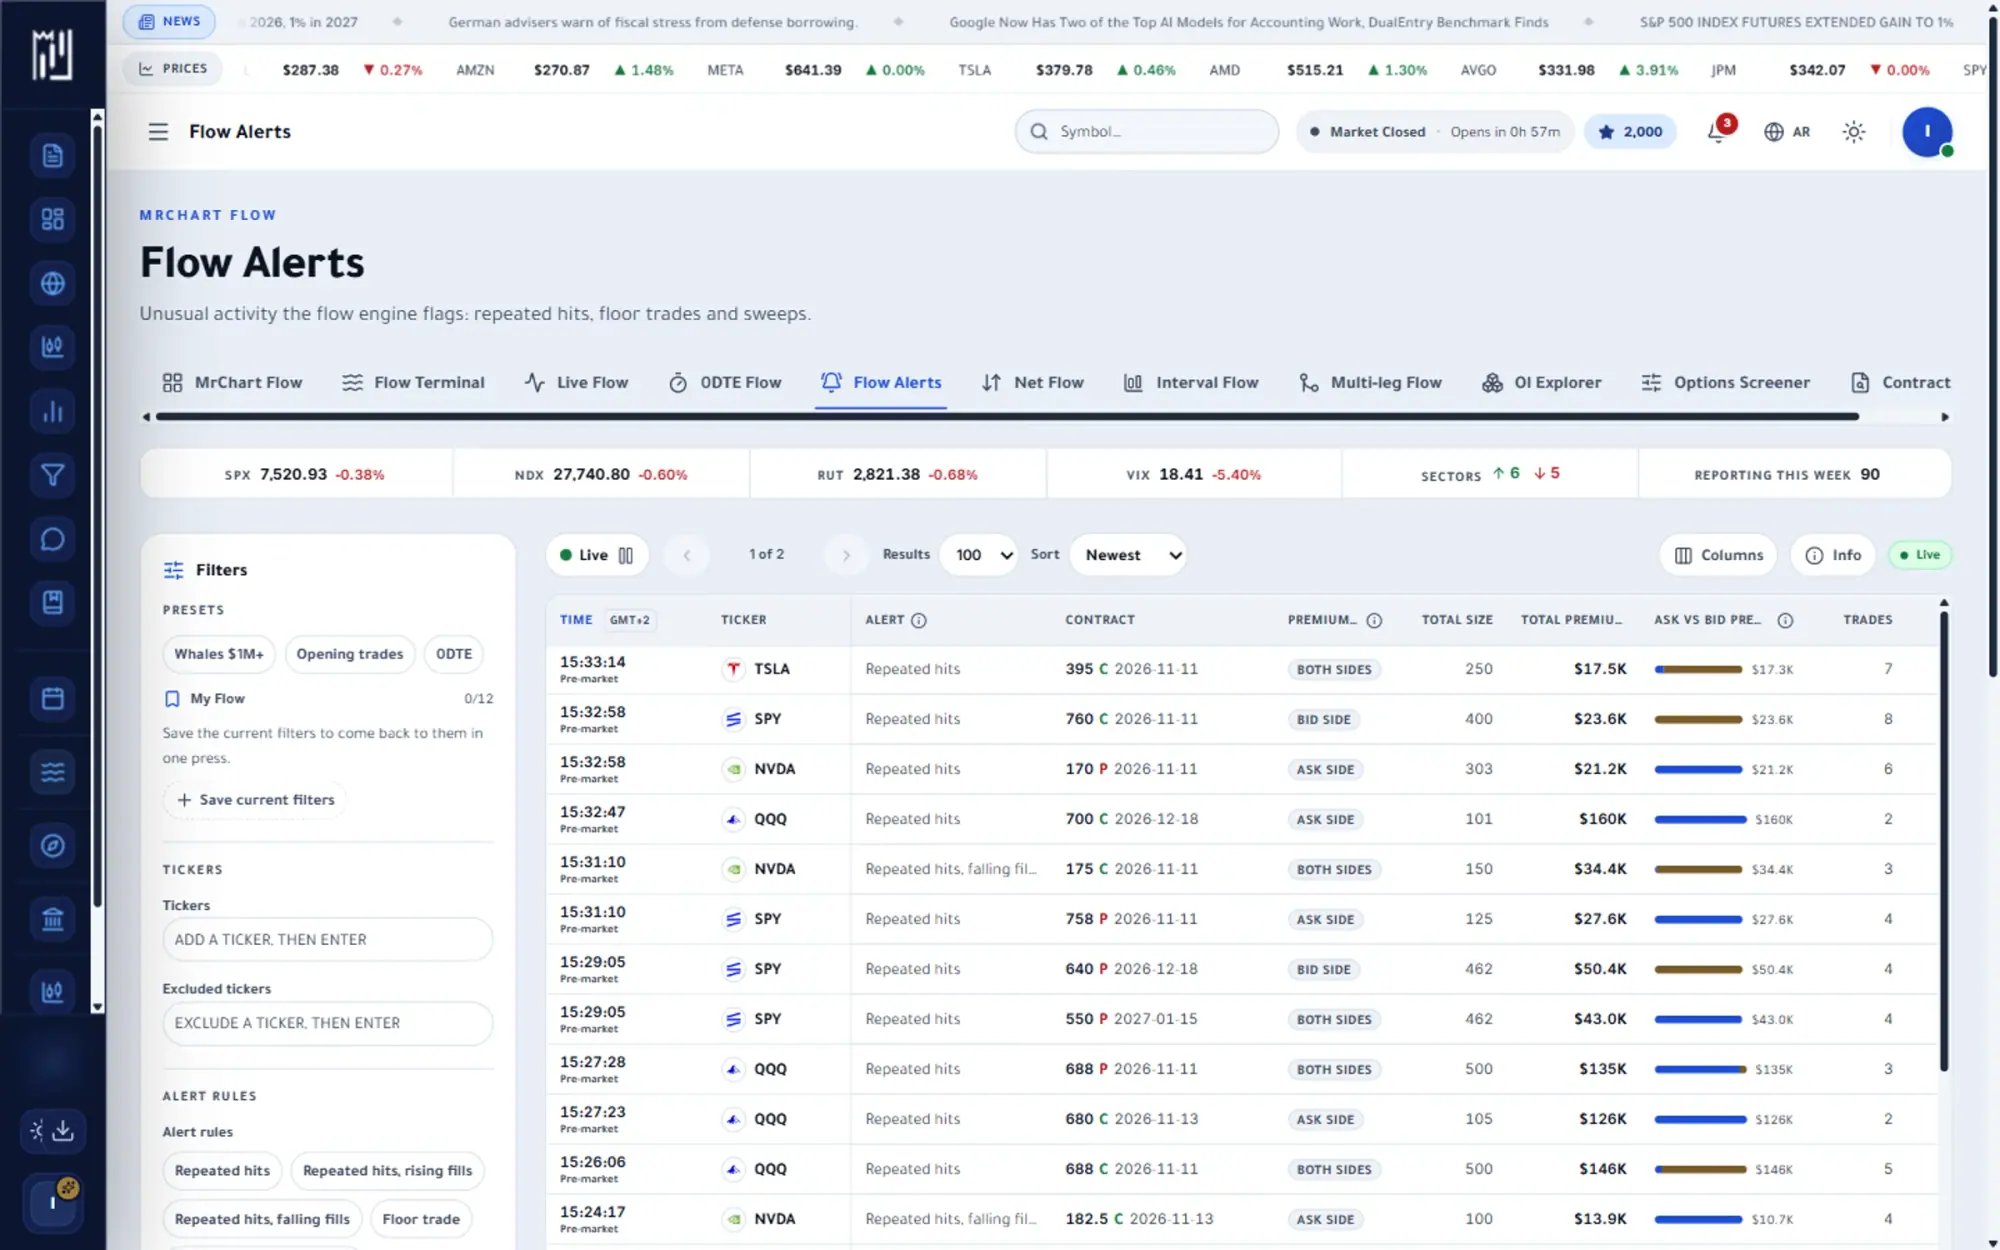
Flow Alerts picks the unusual options activity out of the tape so you do not have to scan every print. The flow engine flags patterns such as repeated hits on one contract, floor trades, sweeps followed by a floor trade, and low-volume contracts that suddenly trade, then lists each one as it appears.
Every alert names the rule that raised it, shows the total premium, which side of the quote carried most of it, and the contract and session details. You can filter by ticker or rule and load up to seven days of older alerts. The aim is understanding what was unusual, not telling you what to do about it.
What you get
Why use Flow Alerts
How it works
How to use Flow Alerts in three steps
- 01
Scan the alert list
Each row shows the ticker, contract, premium and the rule that flagged it, newest first.
- 02
Filter by rule or ticker
Keep only the patterns you care about, such as repeated hits or floor trades, or narrow the list to your own watch names.
- 03
Open an alert
The detail panel explains the contract and session, with the premium split between ask side and bid side.
Who it helps
Where it fits in your day
A fast morning scan
Skim the latest alerts to see which tickers drew unusual options activity before you decide what to research.
Researching a flagged name
Open an alert, then jump to the contract or the Flow Terminal to see the positioning around it.
Reviewing the past week
Load older alerts to see whether a ticker has been flagged repeatedly over the last seven days.
Questions
Frequently asked questions
What is unusual options activity?
It is options trading that stands out from normal behaviour for a contract, for example repeated trades on the same contract or large trades on an exchange floor. MrChart flags these patterns so they are easy to find.
Why was this trade flagged?
Each alert shows the rule that raised it, such as repeated hits, a floor trade or sweeps followed by a floor trade. A flag means the activity matched a pattern, not that the stock will move a certain way.
How far back do flow alerts go?
You can load alerts from the last seven days with the older alerts button. The page tells you when you have reached the end of that history.
See it on your own screen
Create a free account and open it in the platform. MrChart is an analytics and education platform. It does not give buy or sell recommendations or investment advice.