Stock Analysis
A full, readable analysis of any U.S. stock: the business, the numbers, the levels and the story, on one page.
- MrChart Score and Value
- Everything about the company
- Explained in plain language
The question it answers
How do I understand this stock?
Overview
What is Stock Analysis on MrChart?
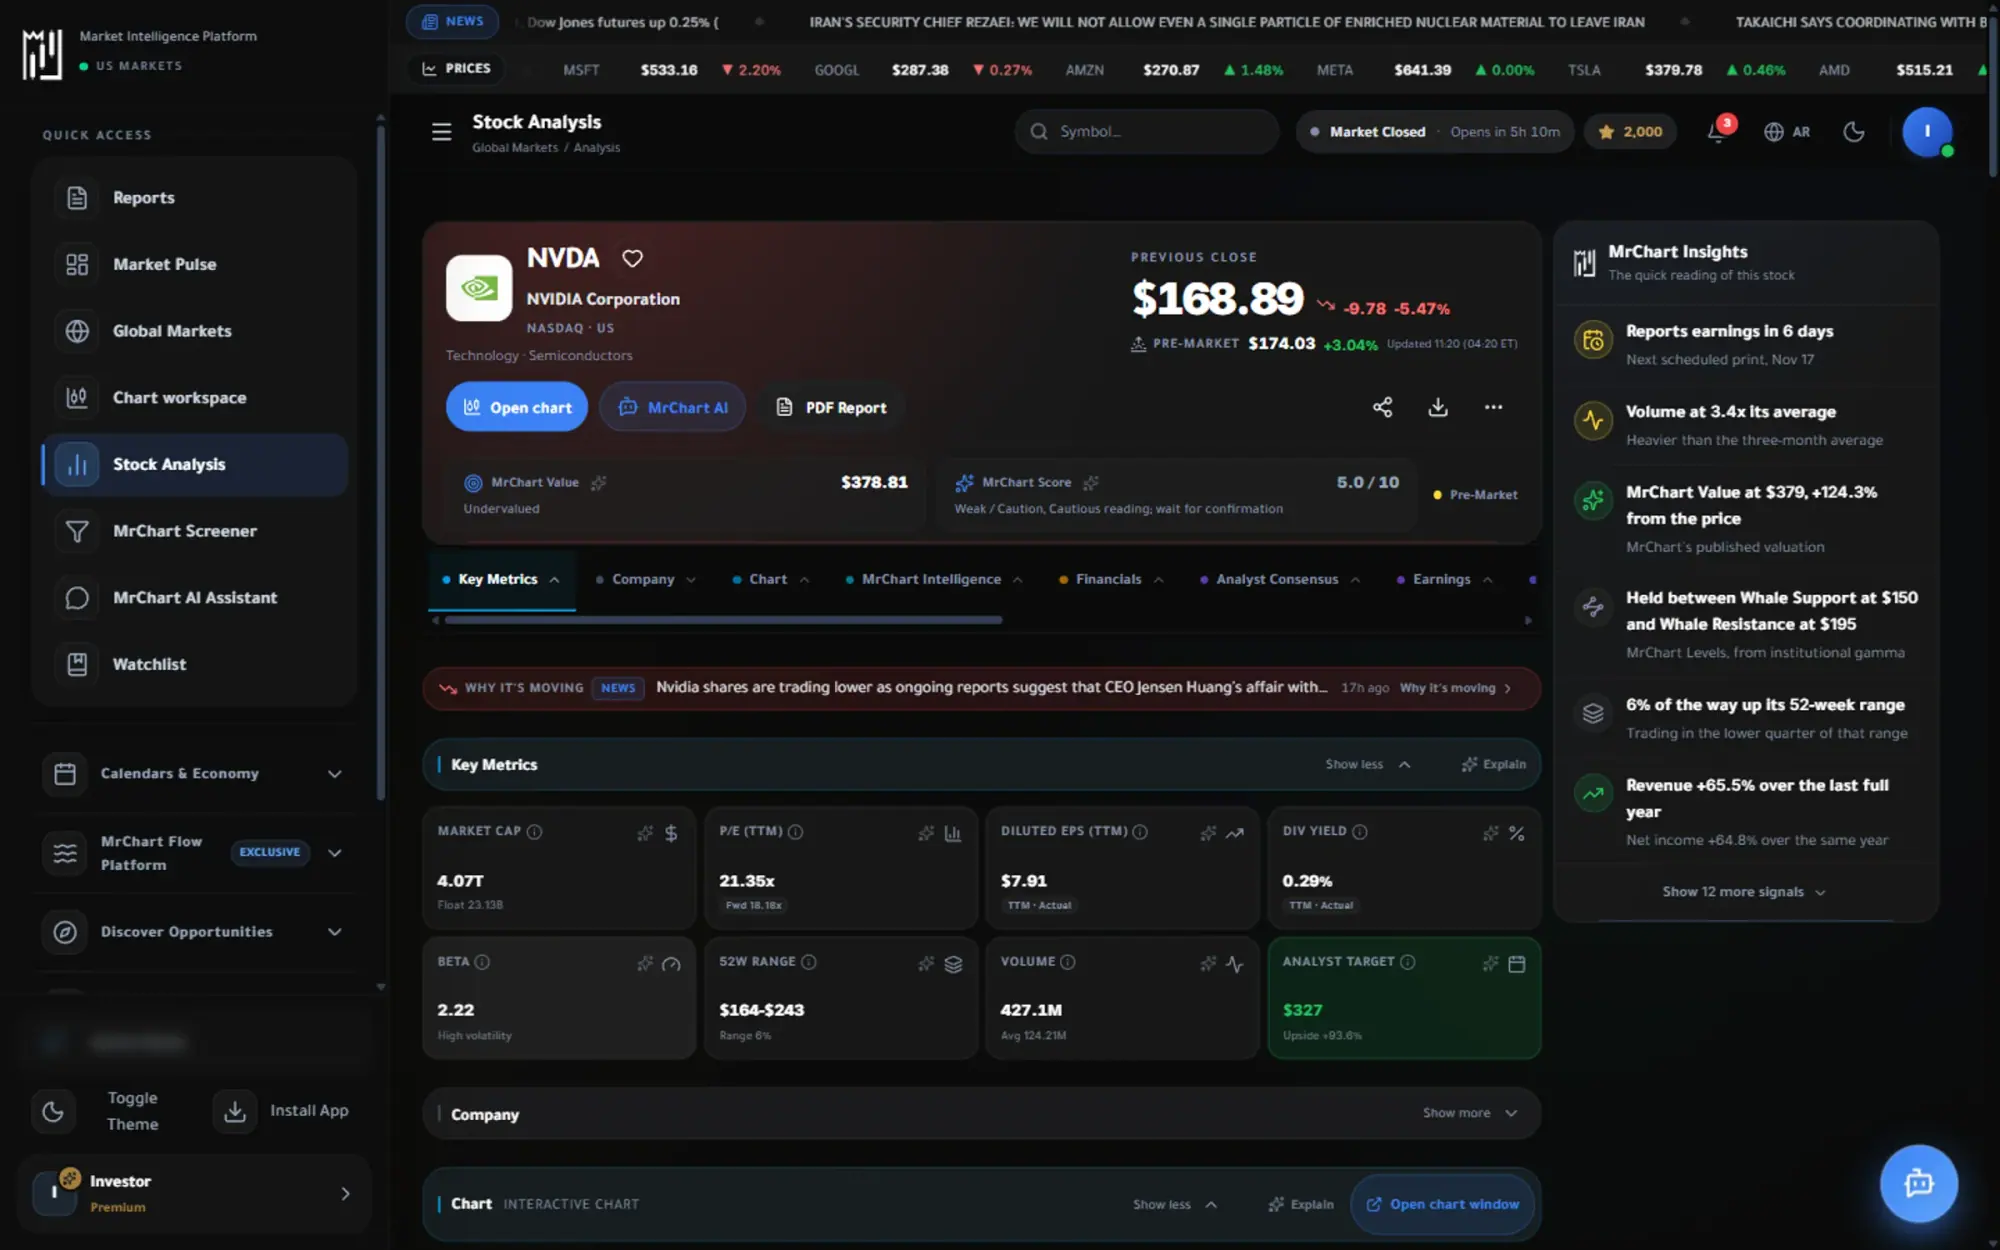
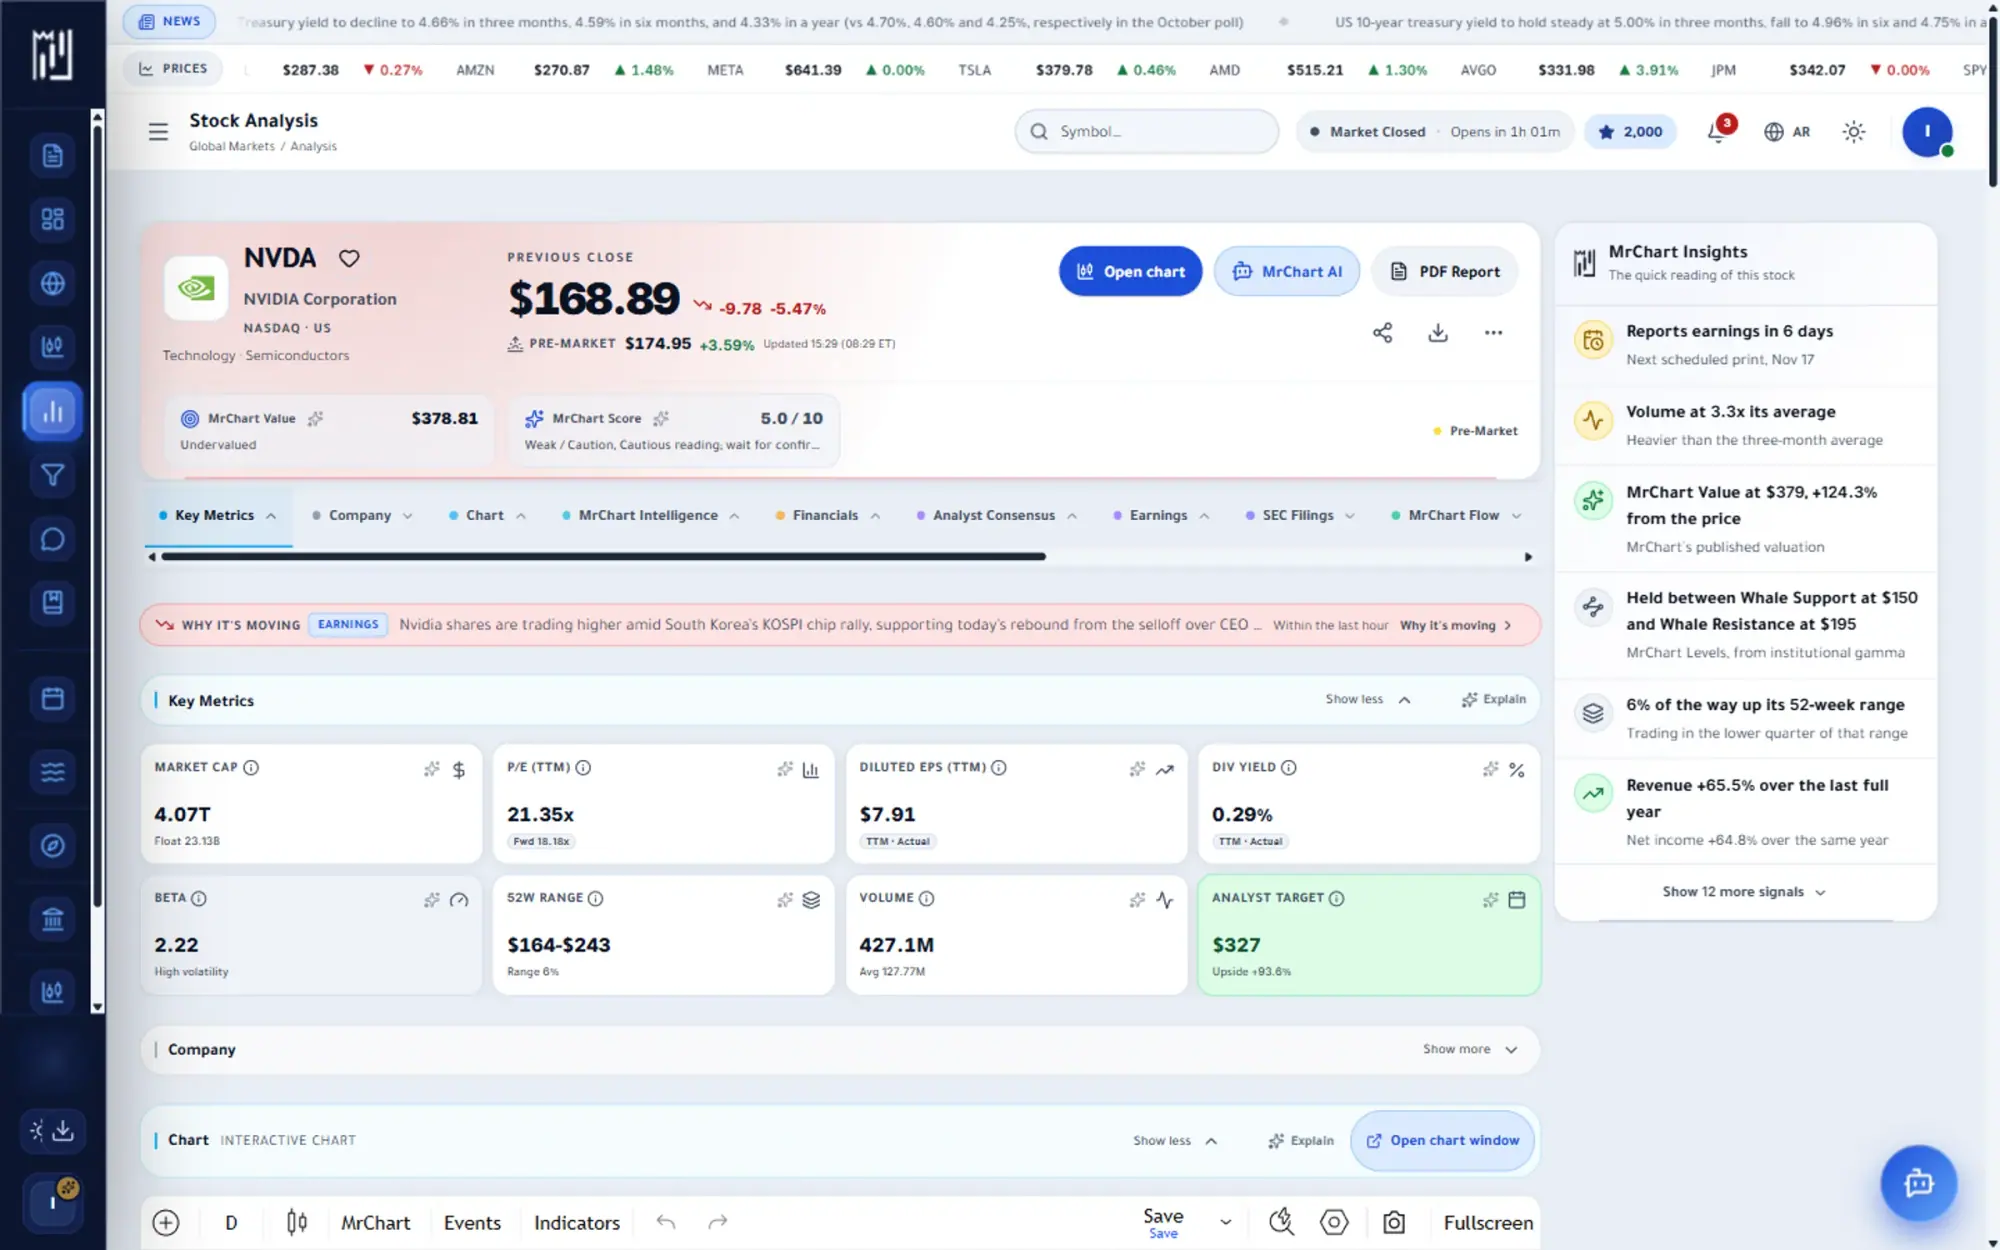
Stock analysis on MrChart brings together what you would normally open ten tabs to find. Enter a U.S. ticker and one page opens on key metrics, then walks through the company, the price chart, MrChart Intelligence, quality, analyst views, earnings, filings, options, ownership, catalysts and an AI report.
Every chapter opens and closes, so you read the part you care about first. The MrChart Score rates a stock from 1 to 10 across four pillars, technical, fundamental, value and risk, and MrChart Value gives a fair-value read with its reasoning. It is analysis to help you understand a company, not advice.
In the platform
A closer look at Stock Analysis
What you get
Why use Stock Analysis
MrChart Score and Value
A score out of 10 and a fair-value read, each with the reasons behind it.
Everything about the company
Financials, ownership, analyst views, news and options activity without leaving the page.
Explained in plain language
The Explain button turns any figure into what it means and how to read it.
How it works
How to use Stock Analysis in three steps
- 01
Search for a ticker
Type a company name or symbol and open its analysis page. Recent searches are kept so you can return in one tap.
- 02
Start with the key metrics
Read the headline tiles first, then use the chapter strip to jump to the price, quality, analysts or earnings.
- 03
Ask for an explanation
Use the Explain button on any figure to see what it means and how to read it in plain language.
Who it helps
Where it fits in your day
Researching a new idea
Understand a company you have just heard about, from its business and numbers to its chart, in a single sitting.
Checking a stock you already follow
Review the latest earnings, analyst actions and ownership changes before you revisit your own plan.
Learning to read fundamentals
Use the plain-language explanations to learn what margins, ratios and quality readings really say about a business.
Questions
Frequently asked questions
What is the MrChart Score?
It is a composite reading from 1 to 10 built from four pillars: technical, fundamental, value and risk. The page shows the pillar breakdown and how the score is worked out, so you can see why a stock reads the way it does.
How do I analyse a stock before investing?
Start with the key metrics, then move through quality, earnings, analyst views and ownership, and check the chart for context. MrChart organises these readings for learning and research, and decisions remain yours.
Is stock analysis free on MrChart?
Some chapters and readings depend on your plan. The pricing page shows exactly what each plan includes.
More in Analysis & research
See it on your own screen
Create a free account and open it in the platform. MrChart is an analytics and education platform. It does not give buy or sell recommendations or investment advice.