Chart workspace
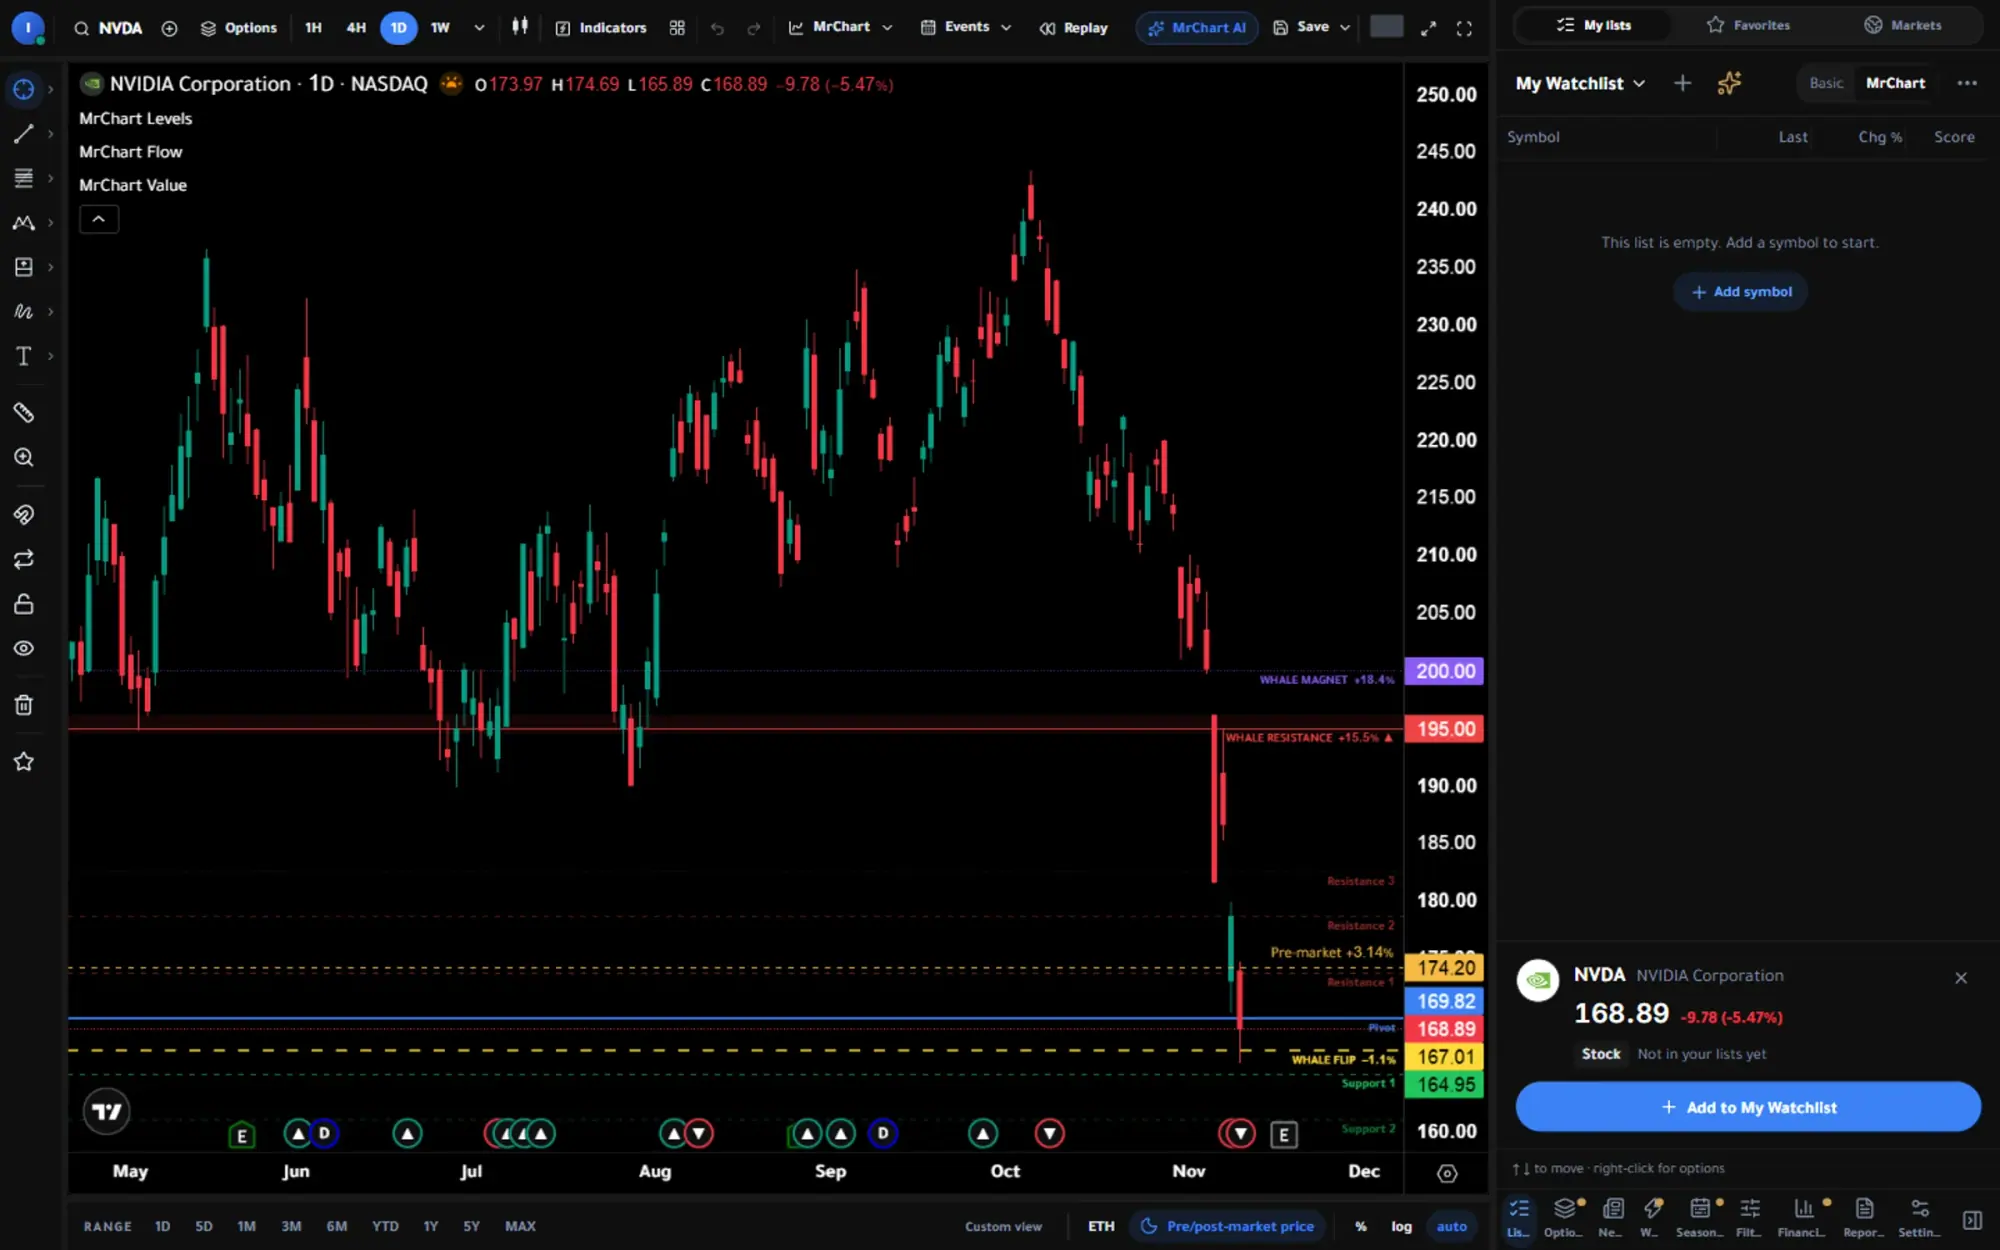
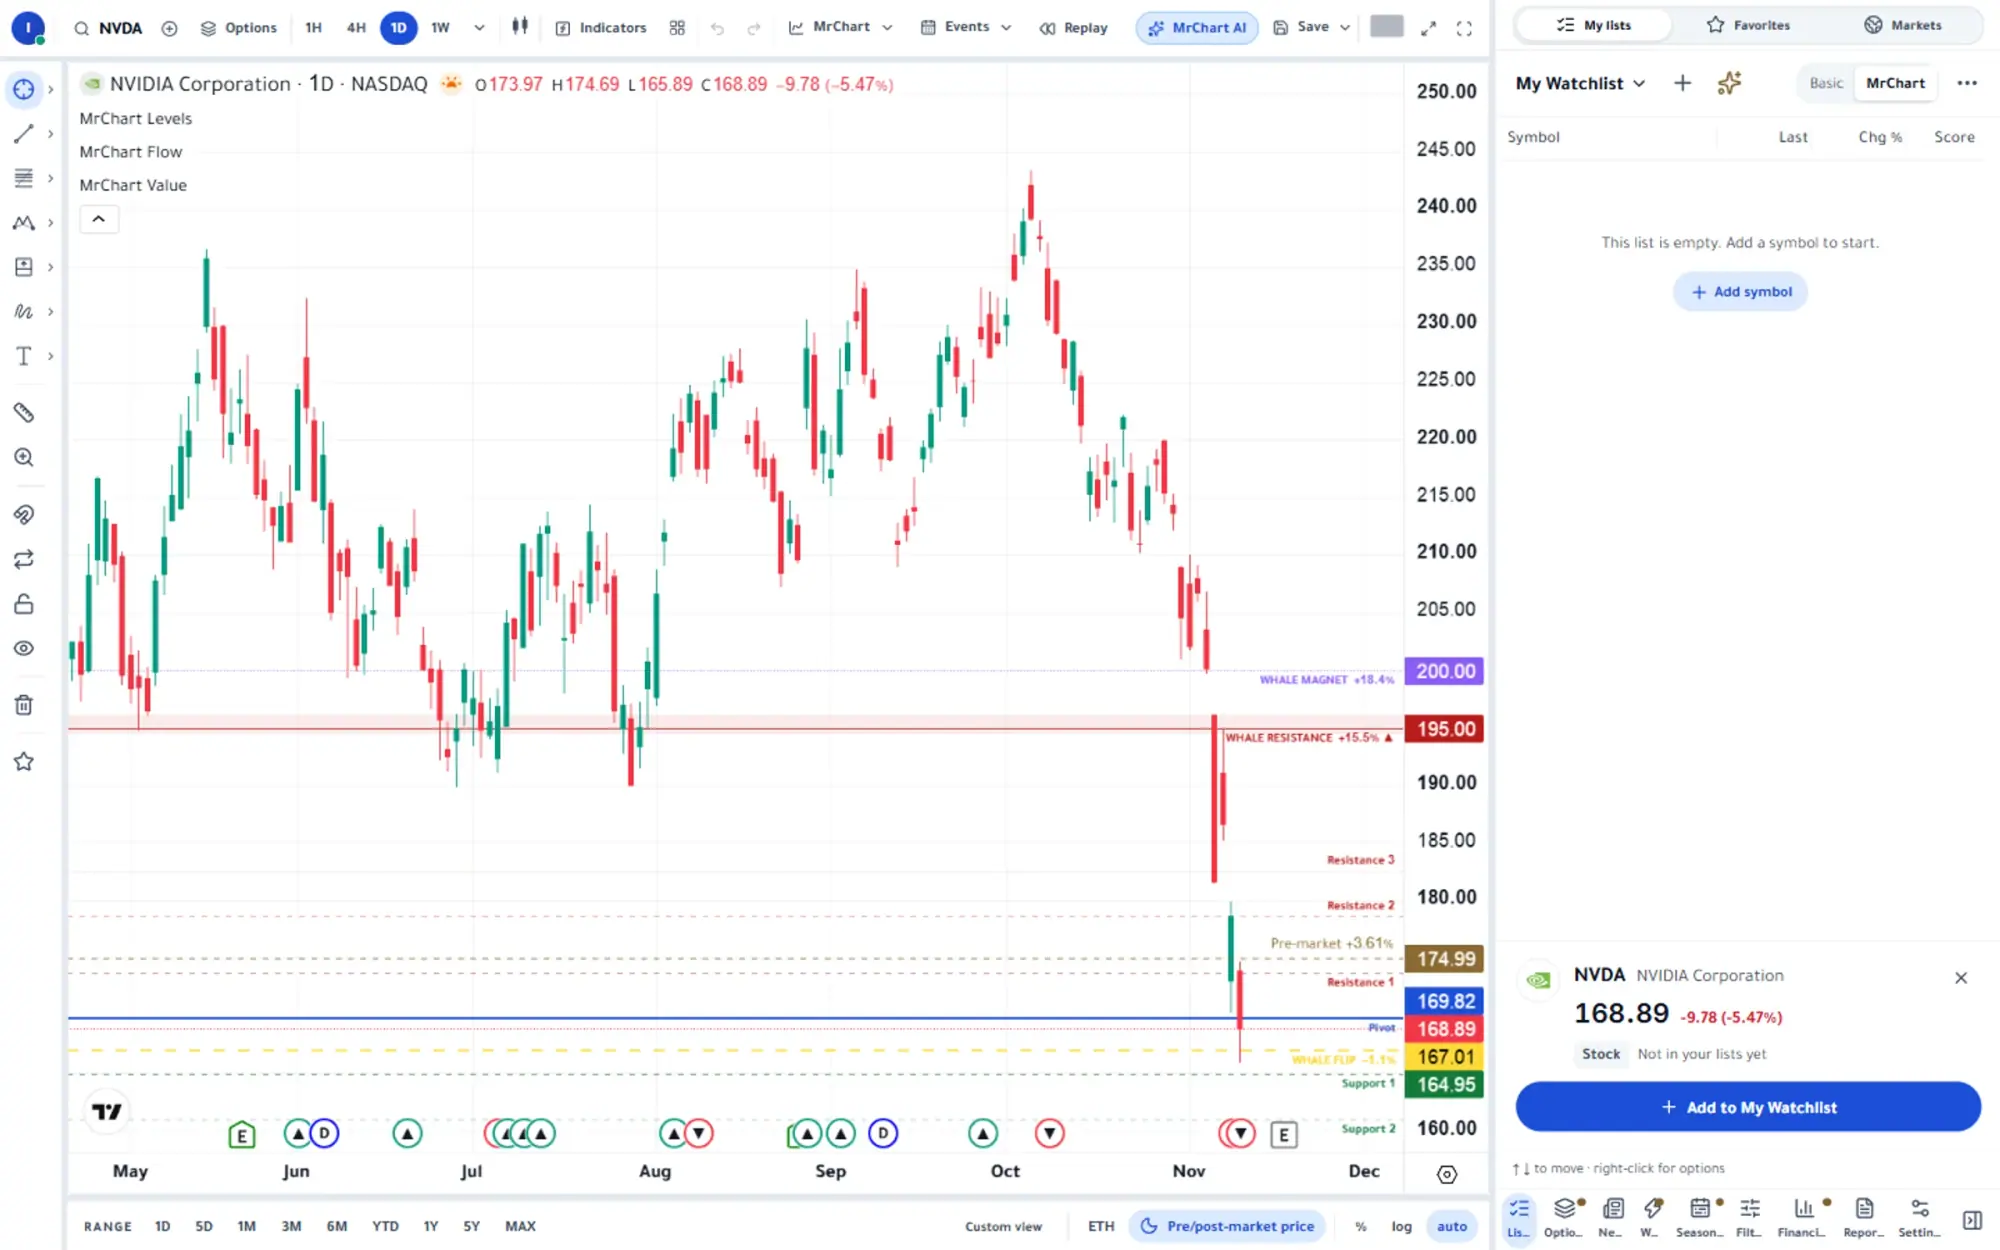
A professional charting workspace with multi-pane layouts, studies, drawing tools and MrChart on the chart itself.
- Panes, symbols and timeframes
- MrChart studies on the chart
- Rasim, the chart copilot
The question it answers
Can I analyse a chart the way professionals do?
Overview
What is Chart workspace on MrChart?
The MrChart chart workspace is a full charting platform in your browser. Open several panes in one layout, pick a symbol and timeframe for each, add indicators, draw your own levels and keep a watchlist in the side panel, all saved so the workspace is waiting for you next time.
MrChart studies sit directly on the price. The Pro Engine and the Cloud draw their levels and readings from calculations done on the server, and Rasim, the chart copilot, can mark what you ask for using the real candles. You see the picture; the decisions stay with you.
What you get
Why use Chart workspace
How it works
How to use Chart workspace in three steps
- 01
Choose a layout
Open the layout picker and select how many panes you want. Each pane keeps its own symbol and timeframe.
- 02
Add studies and drawings
Open the indicator library for MrChart studies and classic indicators, and use the drawing rail to mark trendlines and levels.
- 03
Ask Rasim or replay the past
Tell Rasim what to mark on the chart, or use bar replay to step through history candle by candle.
Who it helps
Where it fits in your day
Comparing several charts at once
Place two or four symbols side by side, or one symbol on different timeframes, and see the whole picture without switching tabs.
Practising with bar replay
Replay a past period one candle at a time to test how you would read a setup before the next candle appears.
Sharing a chart idea
Save or share a picture of your chart, with your drawings and studies on it, to discuss or keep for later.
Questions
Frequently asked questions
What is a chart workspace?
It is a charting page that holds several charts, a symbol watchlist and your tools together. Your layout, studies and drawings are saved, so you pick up where you left off.
What does Rasim do on the chart?
Rasim is the chart copilot. You describe what you want to see marked, the server works out where it belongs from real candles, and the chart draws it in its own group so you can remove it any time.
How many panes can I open?
The layout picker offers one to four panes, and the number available to you depends on your plan. The pricing page shows what each plan includes.
More in Analysis & research
See it on your own screen
Create a free account and open it in the platform. MrChart is an analytics and education platform. It does not give buy or sell recommendations or investment advice.