Sectors & Industries
See which parts of the market are leading and which are lagging, from broad sectors down to industries.
- Heat at a glance
- Drill down
- Leaders and laggards
The question it answers
Where is the money rotating?
Overview
What is Sectors & Industries on MrChart?
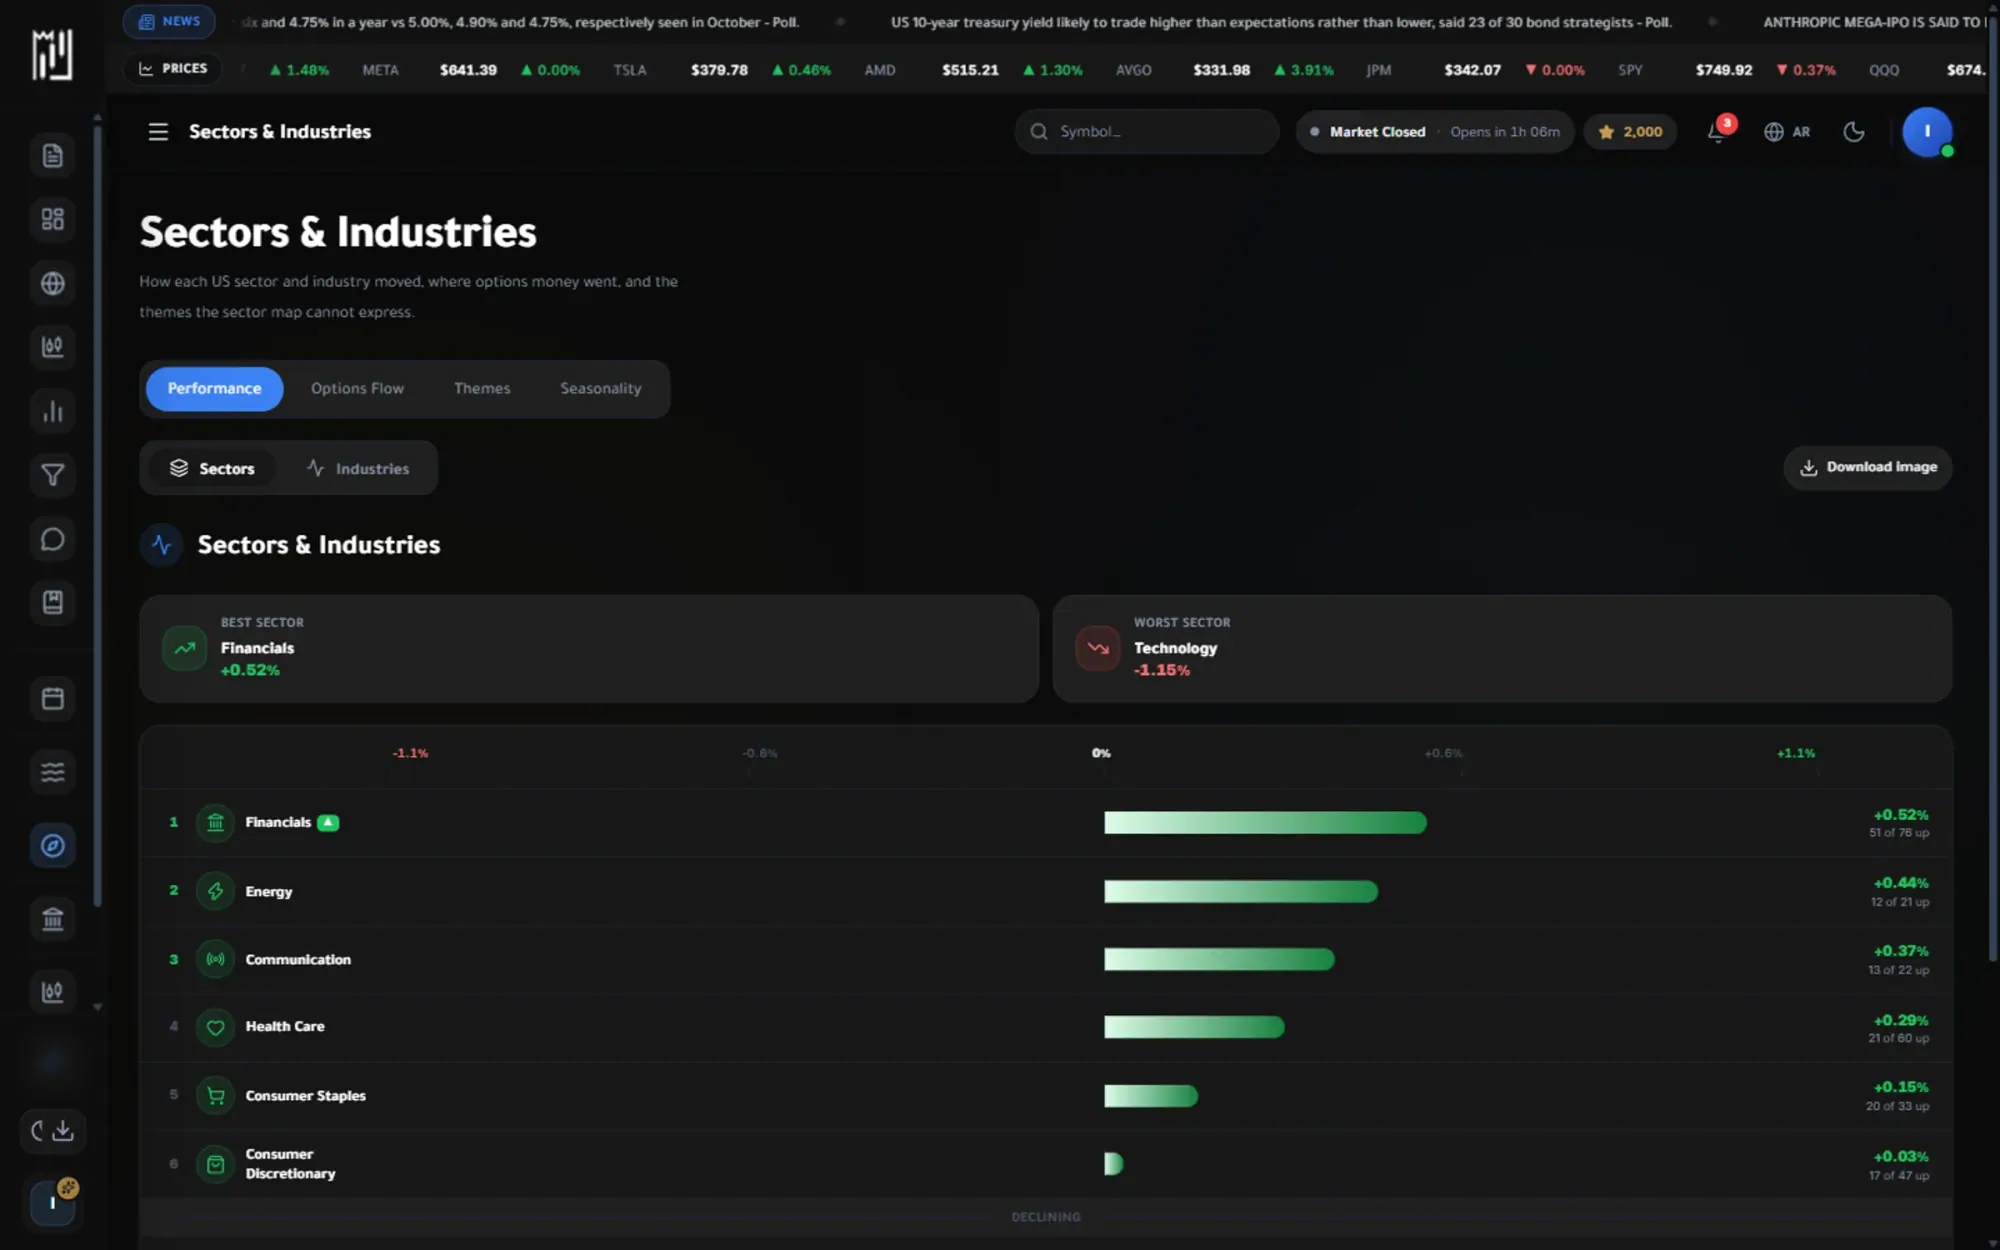
Sectors and Industries shows how each part of the U.S. stock market is performing, from broad sectors down to individual industries. Summary cards name the best and worst sector and industry, and a sector map colours each area by its move, so you can see which parts of the market are leading and which are lagging.
The page has four tabs: performance, options flow, themes and seasonality. Performance covers the sectors and industries, options flow shows where options money went, themes cover ideas that cross sector lines, and seasonality shows how a sector has tended to behave across the calendar. It is a clear way to follow sector rotation.
What you get
Why use Sectors & Industries
How it works
How to use Sectors & Industries in three steps
- 01
Start with the performance tab
Compare sectors by their move, then use the best and worst cards to see the leader and the laggard.
- 02
Drill into industries
Open a sector to see the industries inside it and the stocks that carry its move.
- 03
Add flow, themes and seasonality
Switch tabs to see where options money went, which themes are in play and how the sector has behaved in past years.
Who it helps
Where it fits in your day
Spotting sector rotation
Check whether strength is moving from one sector to another over days and weeks, instead of looking at one stock at a time.
Finding the leaders in a sector
Drill into an industry to see which stocks are leading it and which are being left behind.
Understanding theme-driven moves
Use the themes tab for ideas like new technologies that do not fit neatly inside one sector.
Questions
Frequently asked questions
What is sector rotation?
Sector rotation is the shift of money and attention from one part of the market to another over time. The performance and options flow tabs help you see it as it develops.
What is the difference between a sector and an industry?
A sector is a broad group such as technology or energy, and an industry is a narrower group inside it. MrChart lets you move from the sector view down to the industries and then the stocks.
Does seasonality predict what a sector will do?
No. Seasonality shows how a sector behaved in past years, which is useful context but not a promise about the future.
See it on your own screen
Create a free account and open it in the platform. MrChart is an analytics and education platform. It does not give buy or sell recommendations or investment advice.