Global Markets
Follow Wall Street and the world beside it: major indexes, currencies and benchmarks across regions.
- One map of the world
- See the hand-off
- Context for every move
The question it answers
How are the other markets moving while mine is closed?
Overview
What is Global Markets on MrChart?
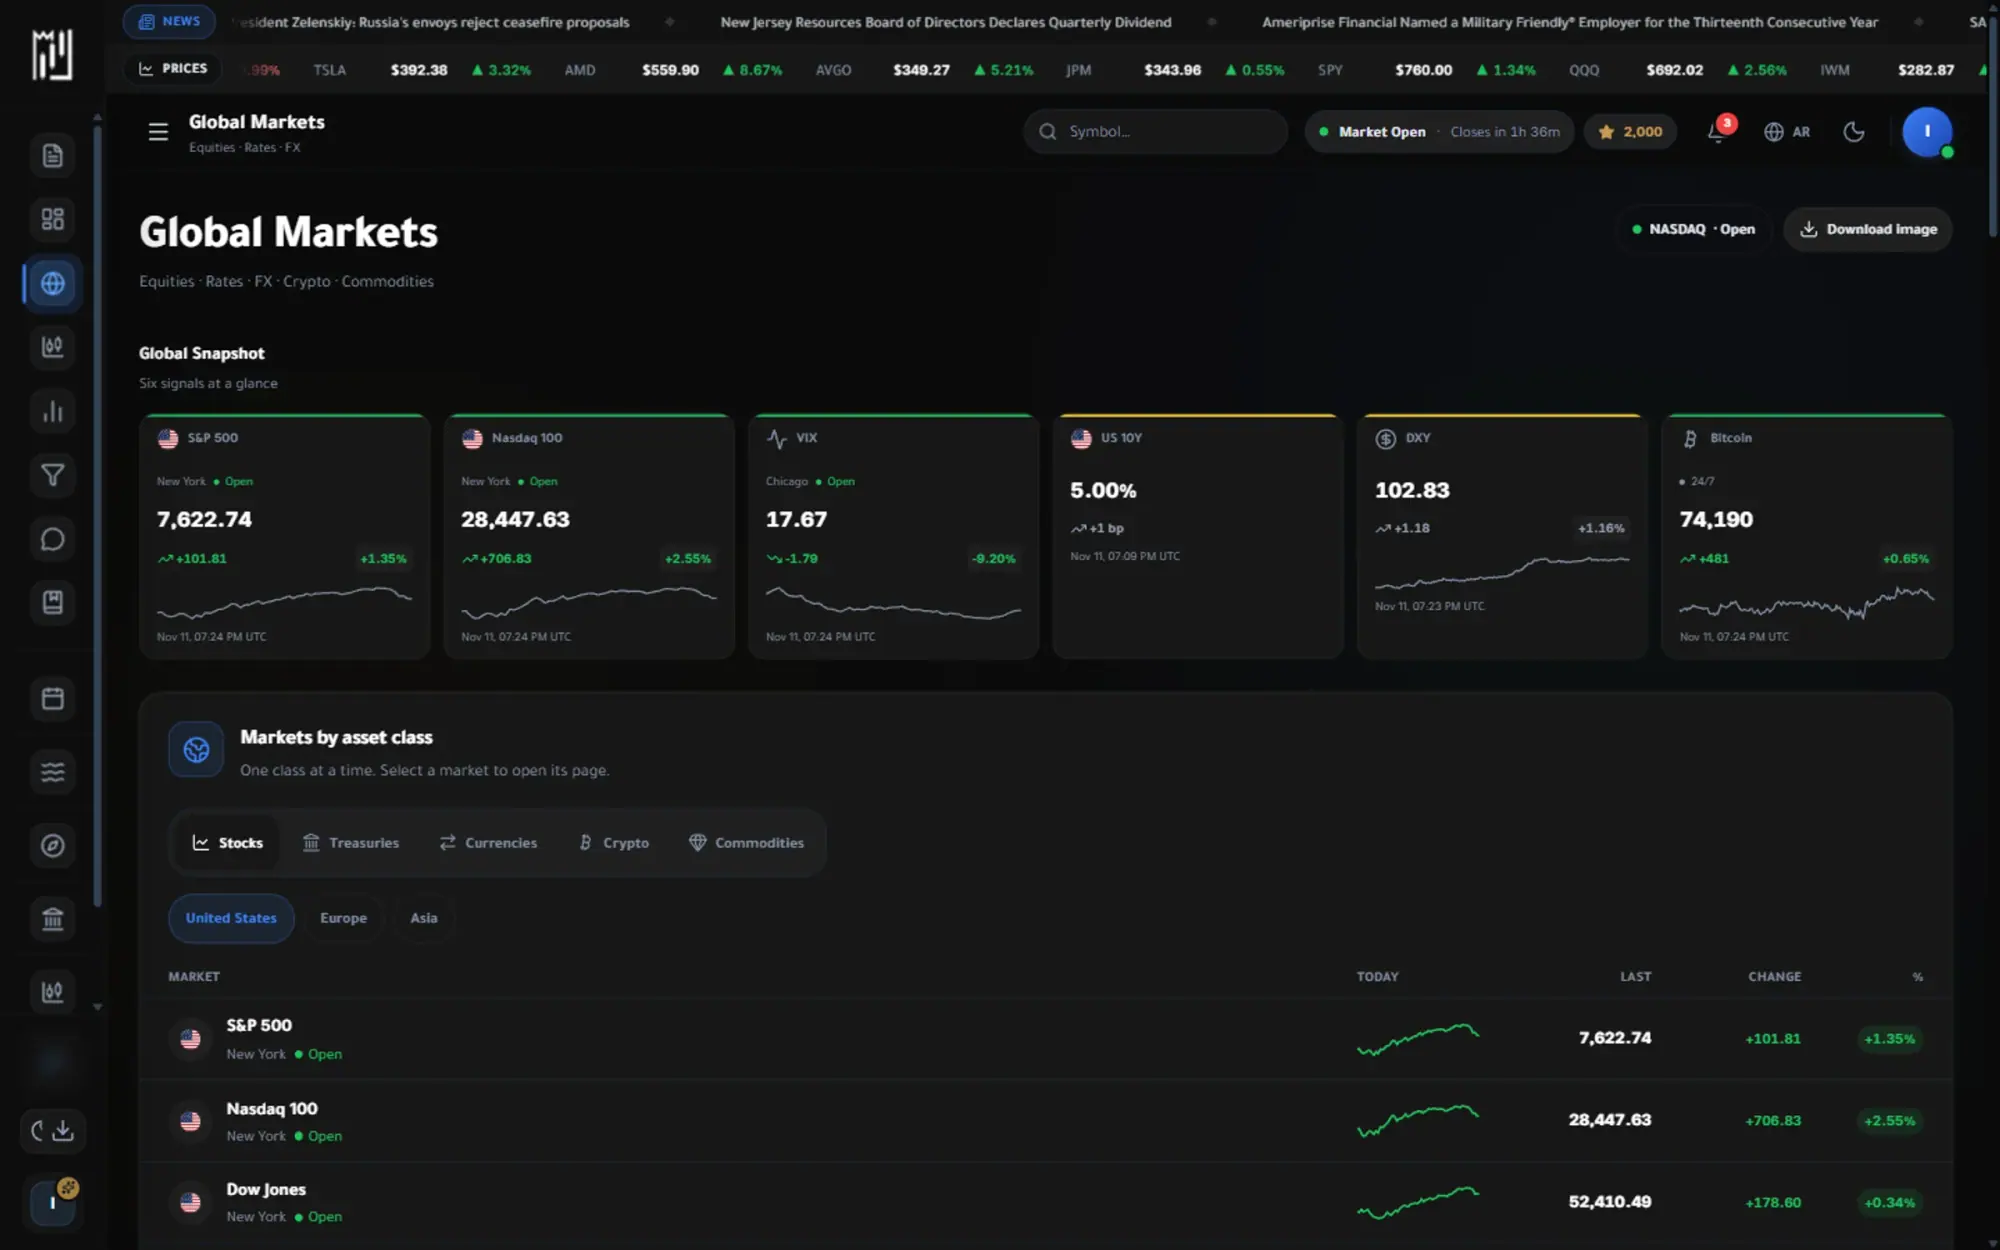
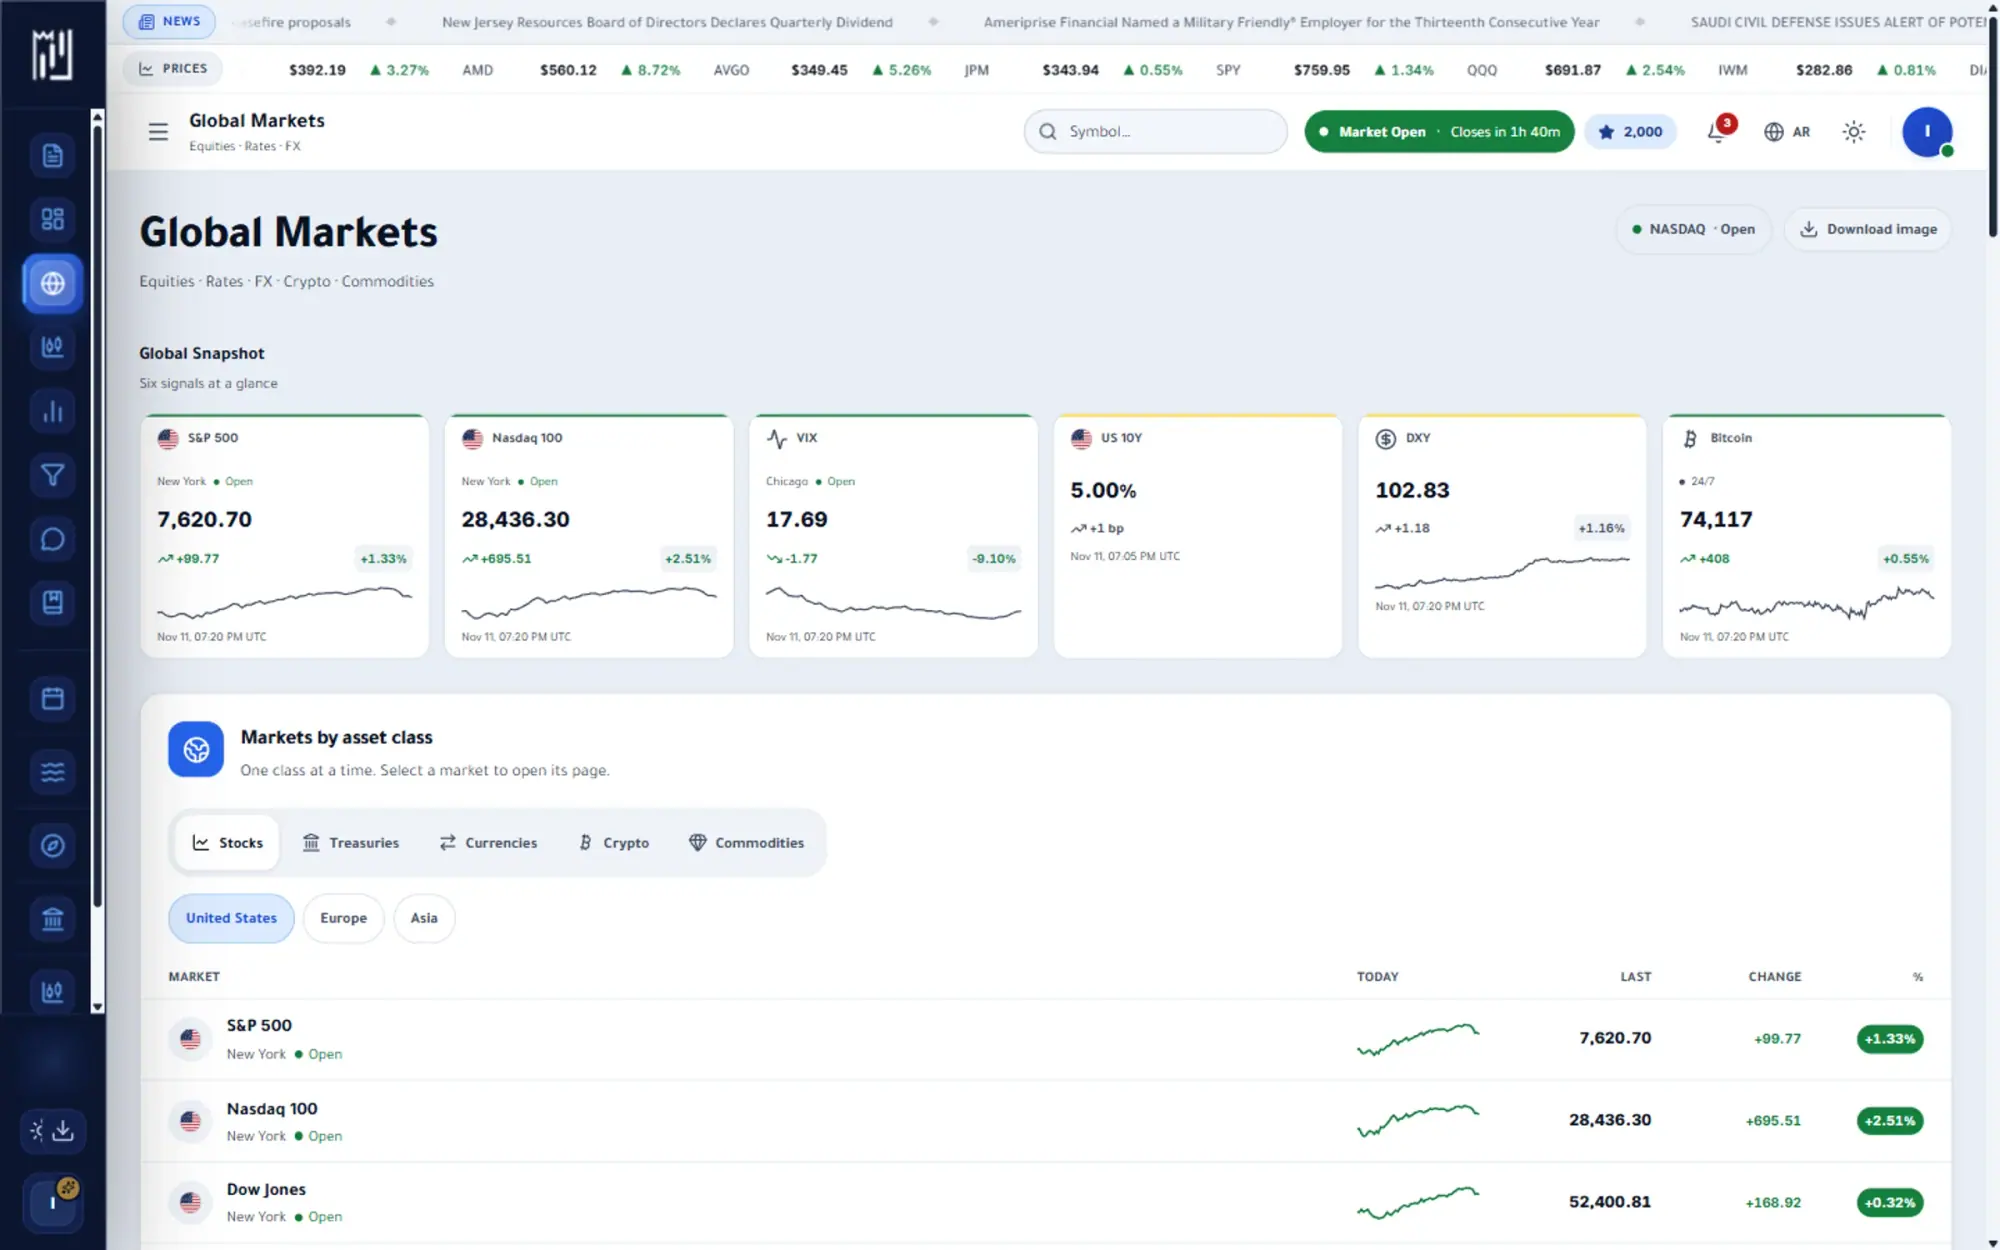
Global Markets gives you one page for the wider market picture: equities, rates, currencies, crypto and commodities. It shows a market status with the exchange hours, index performance, a Fear and Greed Index with its seven components, and a sector map, so you can judge the mood of the market before you look at individual stocks.
Five tabs organise the page: overview, sectors, movers, heatmaps and calendar. The heatmaps cover stocks, crypto, ETFs and forex, so a move in one corner of the market is easy to compare with the others. It is a good first stop when you want to see how the world markets are moving today.
What you get
Why use Global Markets
How it works
How to use Global Markets in three steps
- 01
Check the market status
See whether the market is open, in pre-market or in after-hours, with the exchange hours and time zone shown beside it.
- 02
Read the mood and the indexes
Compare the major indexes with the Fear and Greed Index, then see which index is strongest and which is weakest.
- 03
Switch tabs for more depth
Open sectors, movers, heatmaps or the calendar to see where the strength is and what events are coming up.
Who it helps
Where it fits in your day
Starting the trading day
Look at the market status, indexes and upcoming events to know what kind of session to expect.
Comparing asset classes
Use the heatmaps to see stocks, crypto, ETFs and forex in the same visual language and notice which area is leading.
Planning around events
Use the calendar tab for earnings today and upcoming market holidays or early closes before you plan your week.
Questions
Frequently asked questions
What are global markets?
Global markets are the connected markets for stocks, bonds, currencies, commodities and crypto around the world. MrChart's page puts the main readings of these markets together so you can see how they move relative to each other.
How do I read the Fear and Greed Index?
It is MrChart's 0 to 100 reading of market mood, where low values mean fear and high values mean greed. The page also breaks it into seven components, so you can see what is driving the number.
Is the market data live?
The page shows a last-updated time and has a refresh button, and the data may be delayed. It is information for education and analysis, not investment advice.
See it on your own screen
Create a free account and open it in the platform. MrChart is an analytics and education platform. It does not give buy or sell recommendations or investment advice.