Economy
The macro picture in plain language: growth, inflation, jobs and rates, with the charts behind them.
- The indicators that move markets
- Explained, not just plotted
- Tied to the calendar
The question it answers
What is the economy telling the market?
Overview
What is Economy on MrChart?
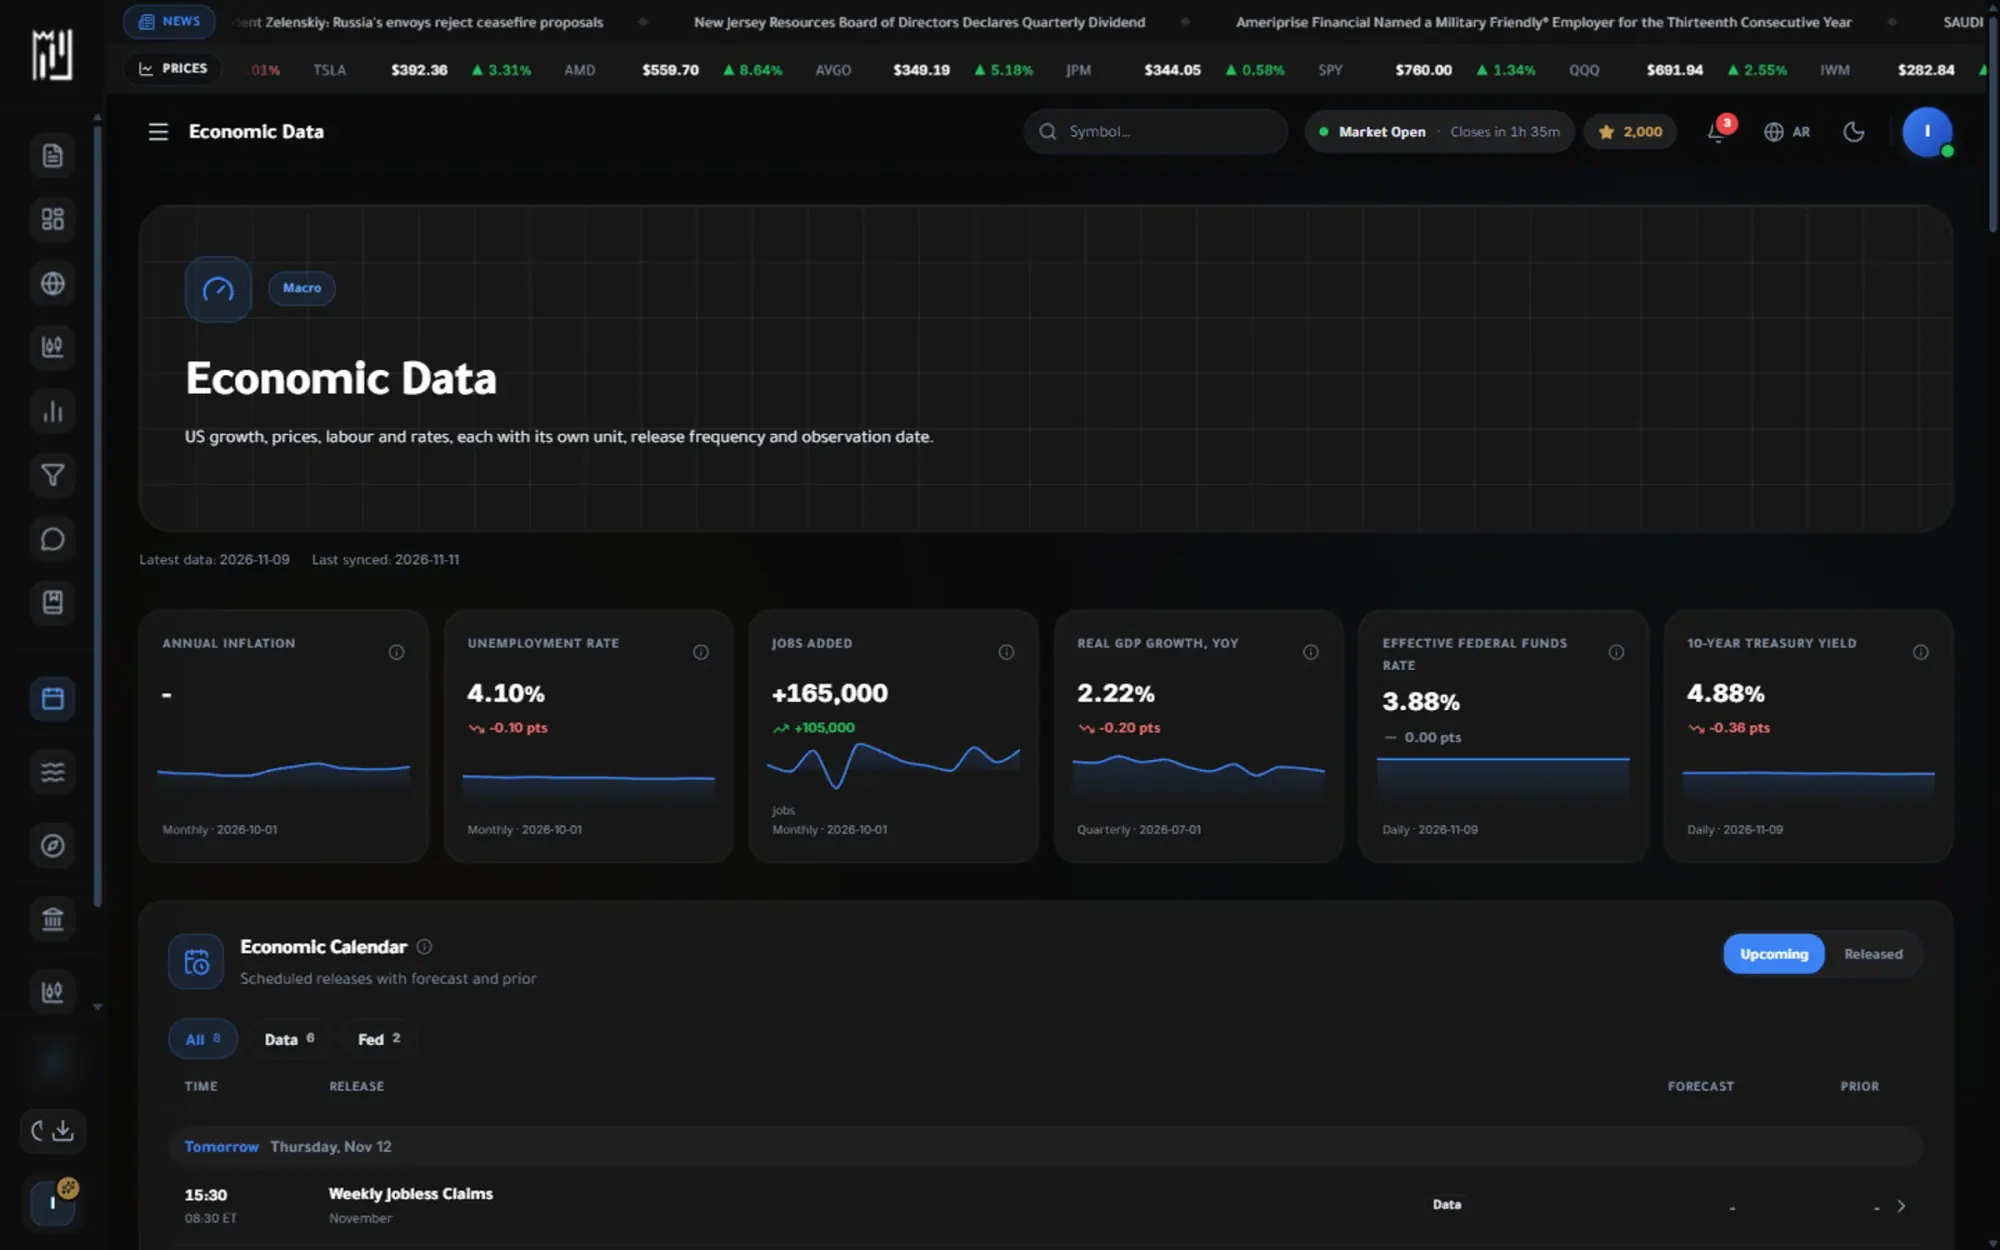
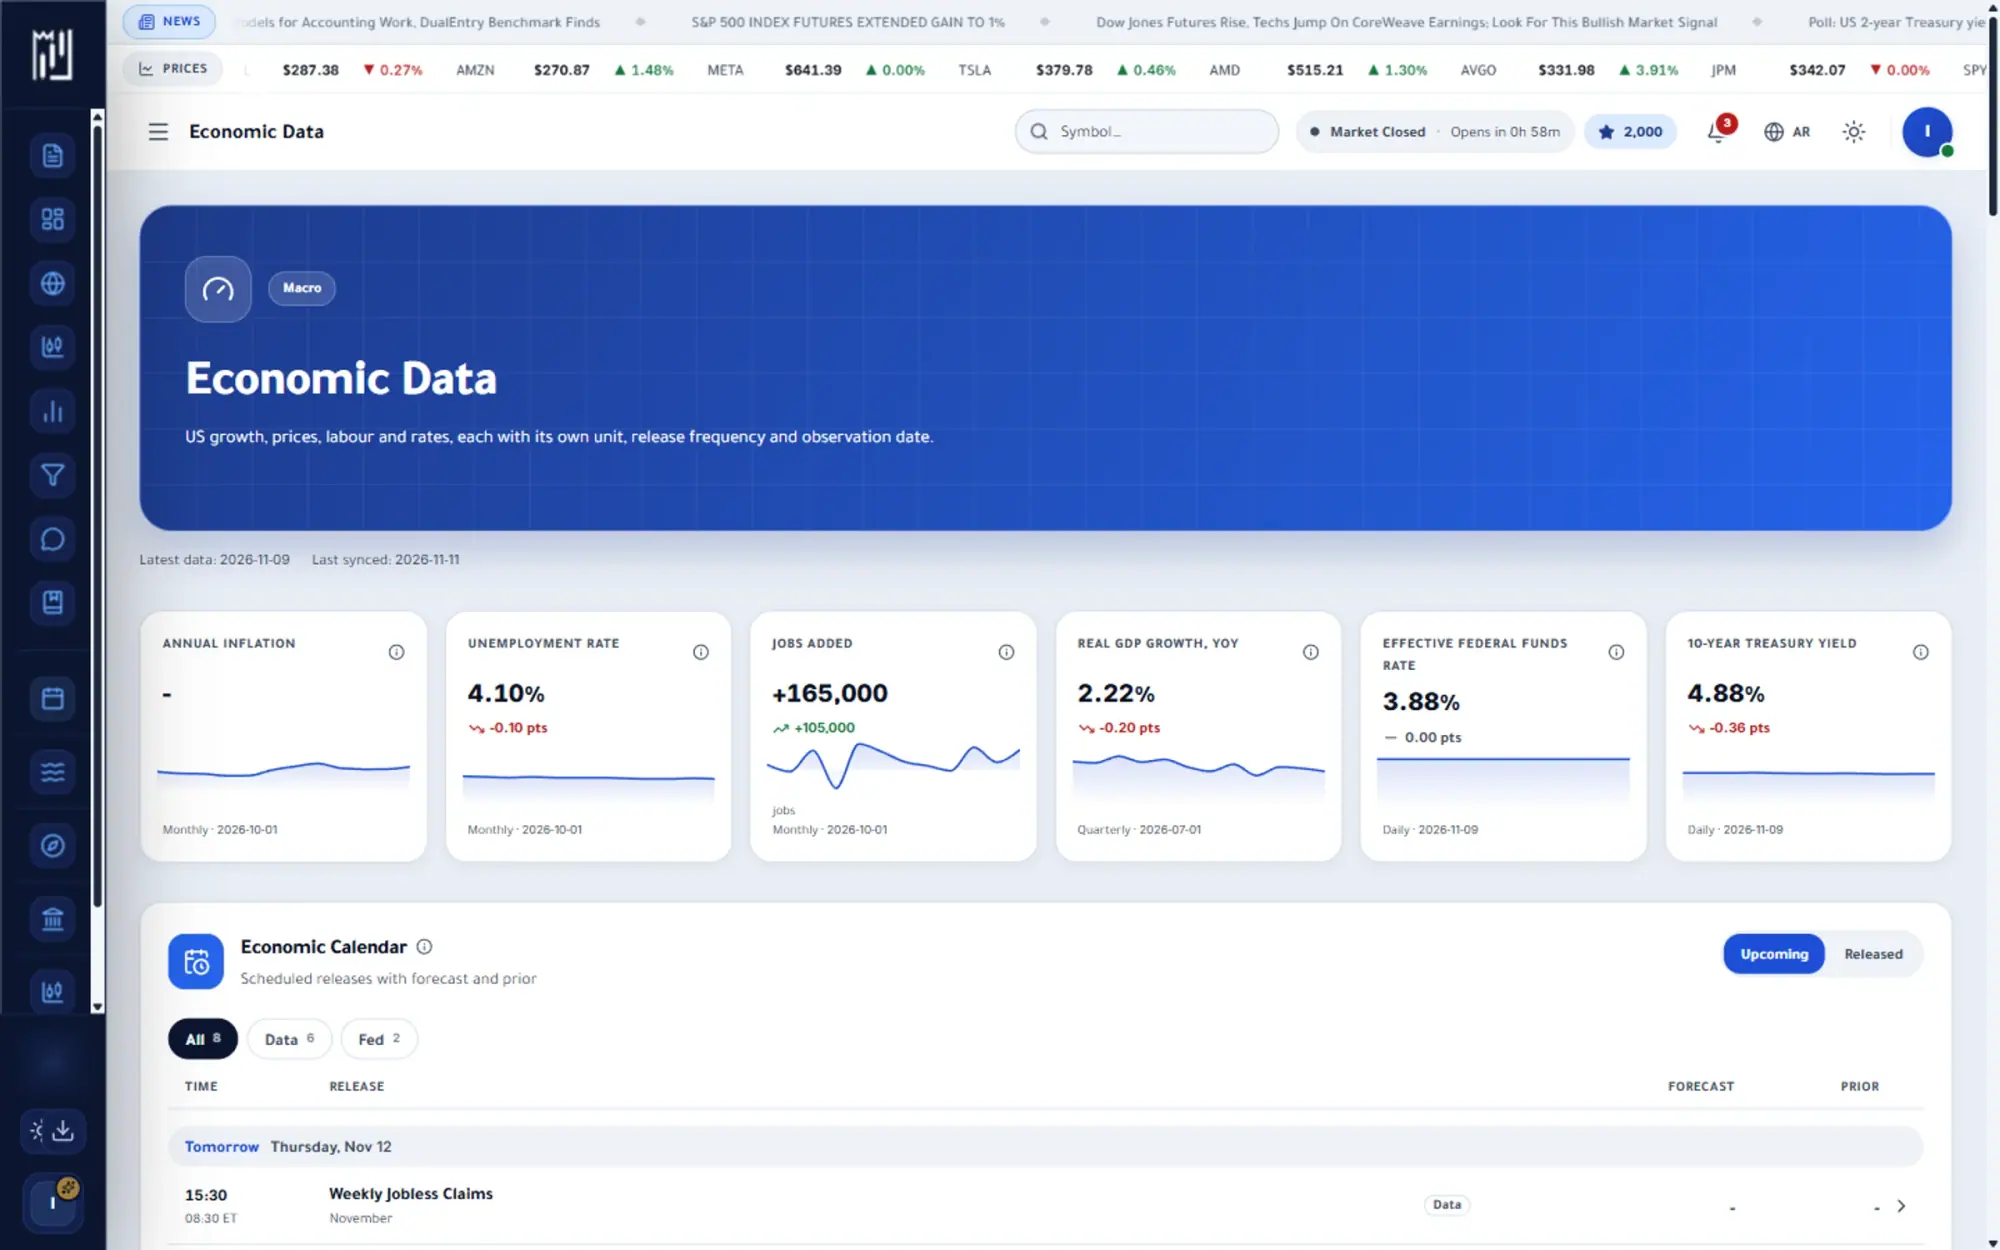
The Economy page gathers the main U.S. economic indicators in one place: growth, prices, labour, rates and activity. Each indicator is shown with its own unit, release frequency and the date of the latest observation, so you always know what a number measures and how current it is.
You can follow inflation, unemployment, jobs added, GDP growth, retail sales and the federal funds rate, and compare year-over-year changes with the raw levels. A Treasury yield curve section shows yields across maturities and whether the curve is inverted, which helps you read the macro backdrop behind market moves.
In the platform
A closer look at Economy
What you get
Why use Economy
The indicators that move markets
Inflation, employment, growth and interest rates gathered in one place, each with its history.
Explained, not just plotted
An Explain button tells you what a figure means and why traders care.
Tied to the calendar
See the release that is coming next and how the last one landed.
How it works
How to use Economy in three steps
- 01
Browse by group
Start with growth, prices, rates, labour or activity, and read each indicator with its unit and release frequency.
- 02
Open a release
Open any indicator to see its history, the latest observation date and details about the release.
- 03
Check the yield curve
See Treasury yields across maturities and the spread between the 10-year and 2-year yield to understand the rate backdrop.
Who it helps
Where it fits in your day
Understanding a market reaction
After a big move, check the latest inflation or jobs figure to see whether the macro data helps explain it.
Following the interest rate story
Track the federal funds rate and the Treasury yield curve to see how rate expectations are shaping the market.
Learning the indicators
Use the notes on each section to learn what inflation, payrolls or GDP actually measure and how they are computed.
Questions
Frequently asked questions
What economic indicators does MrChart show?
The page covers growth, prices, labour, rates and activity, including inflation, unemployment, jobs added, real GDP, retail sales, the federal funds rate and Treasury yields. Each one shows its own unit and release frequency.
What does an inverted yield curve mean?
It means shorter maturities yield more than longer ones. MrChart presents it as a measurement of today's curve, not a forecast of what will happen.
How current is the economic data?
Each indicator shows the date of its latest observation, and the page shows when the data was last synced. Many indicators are released monthly or quarterly, so they naturally lag the market.
See it on your own screen
Create a free account and open it in the platform. MrChart is an analytics and education platform. It does not give buy or sell recommendations or investment advice.